Silicon Valley Bank Results Presentation Deck
Non-GAAP reconciliation
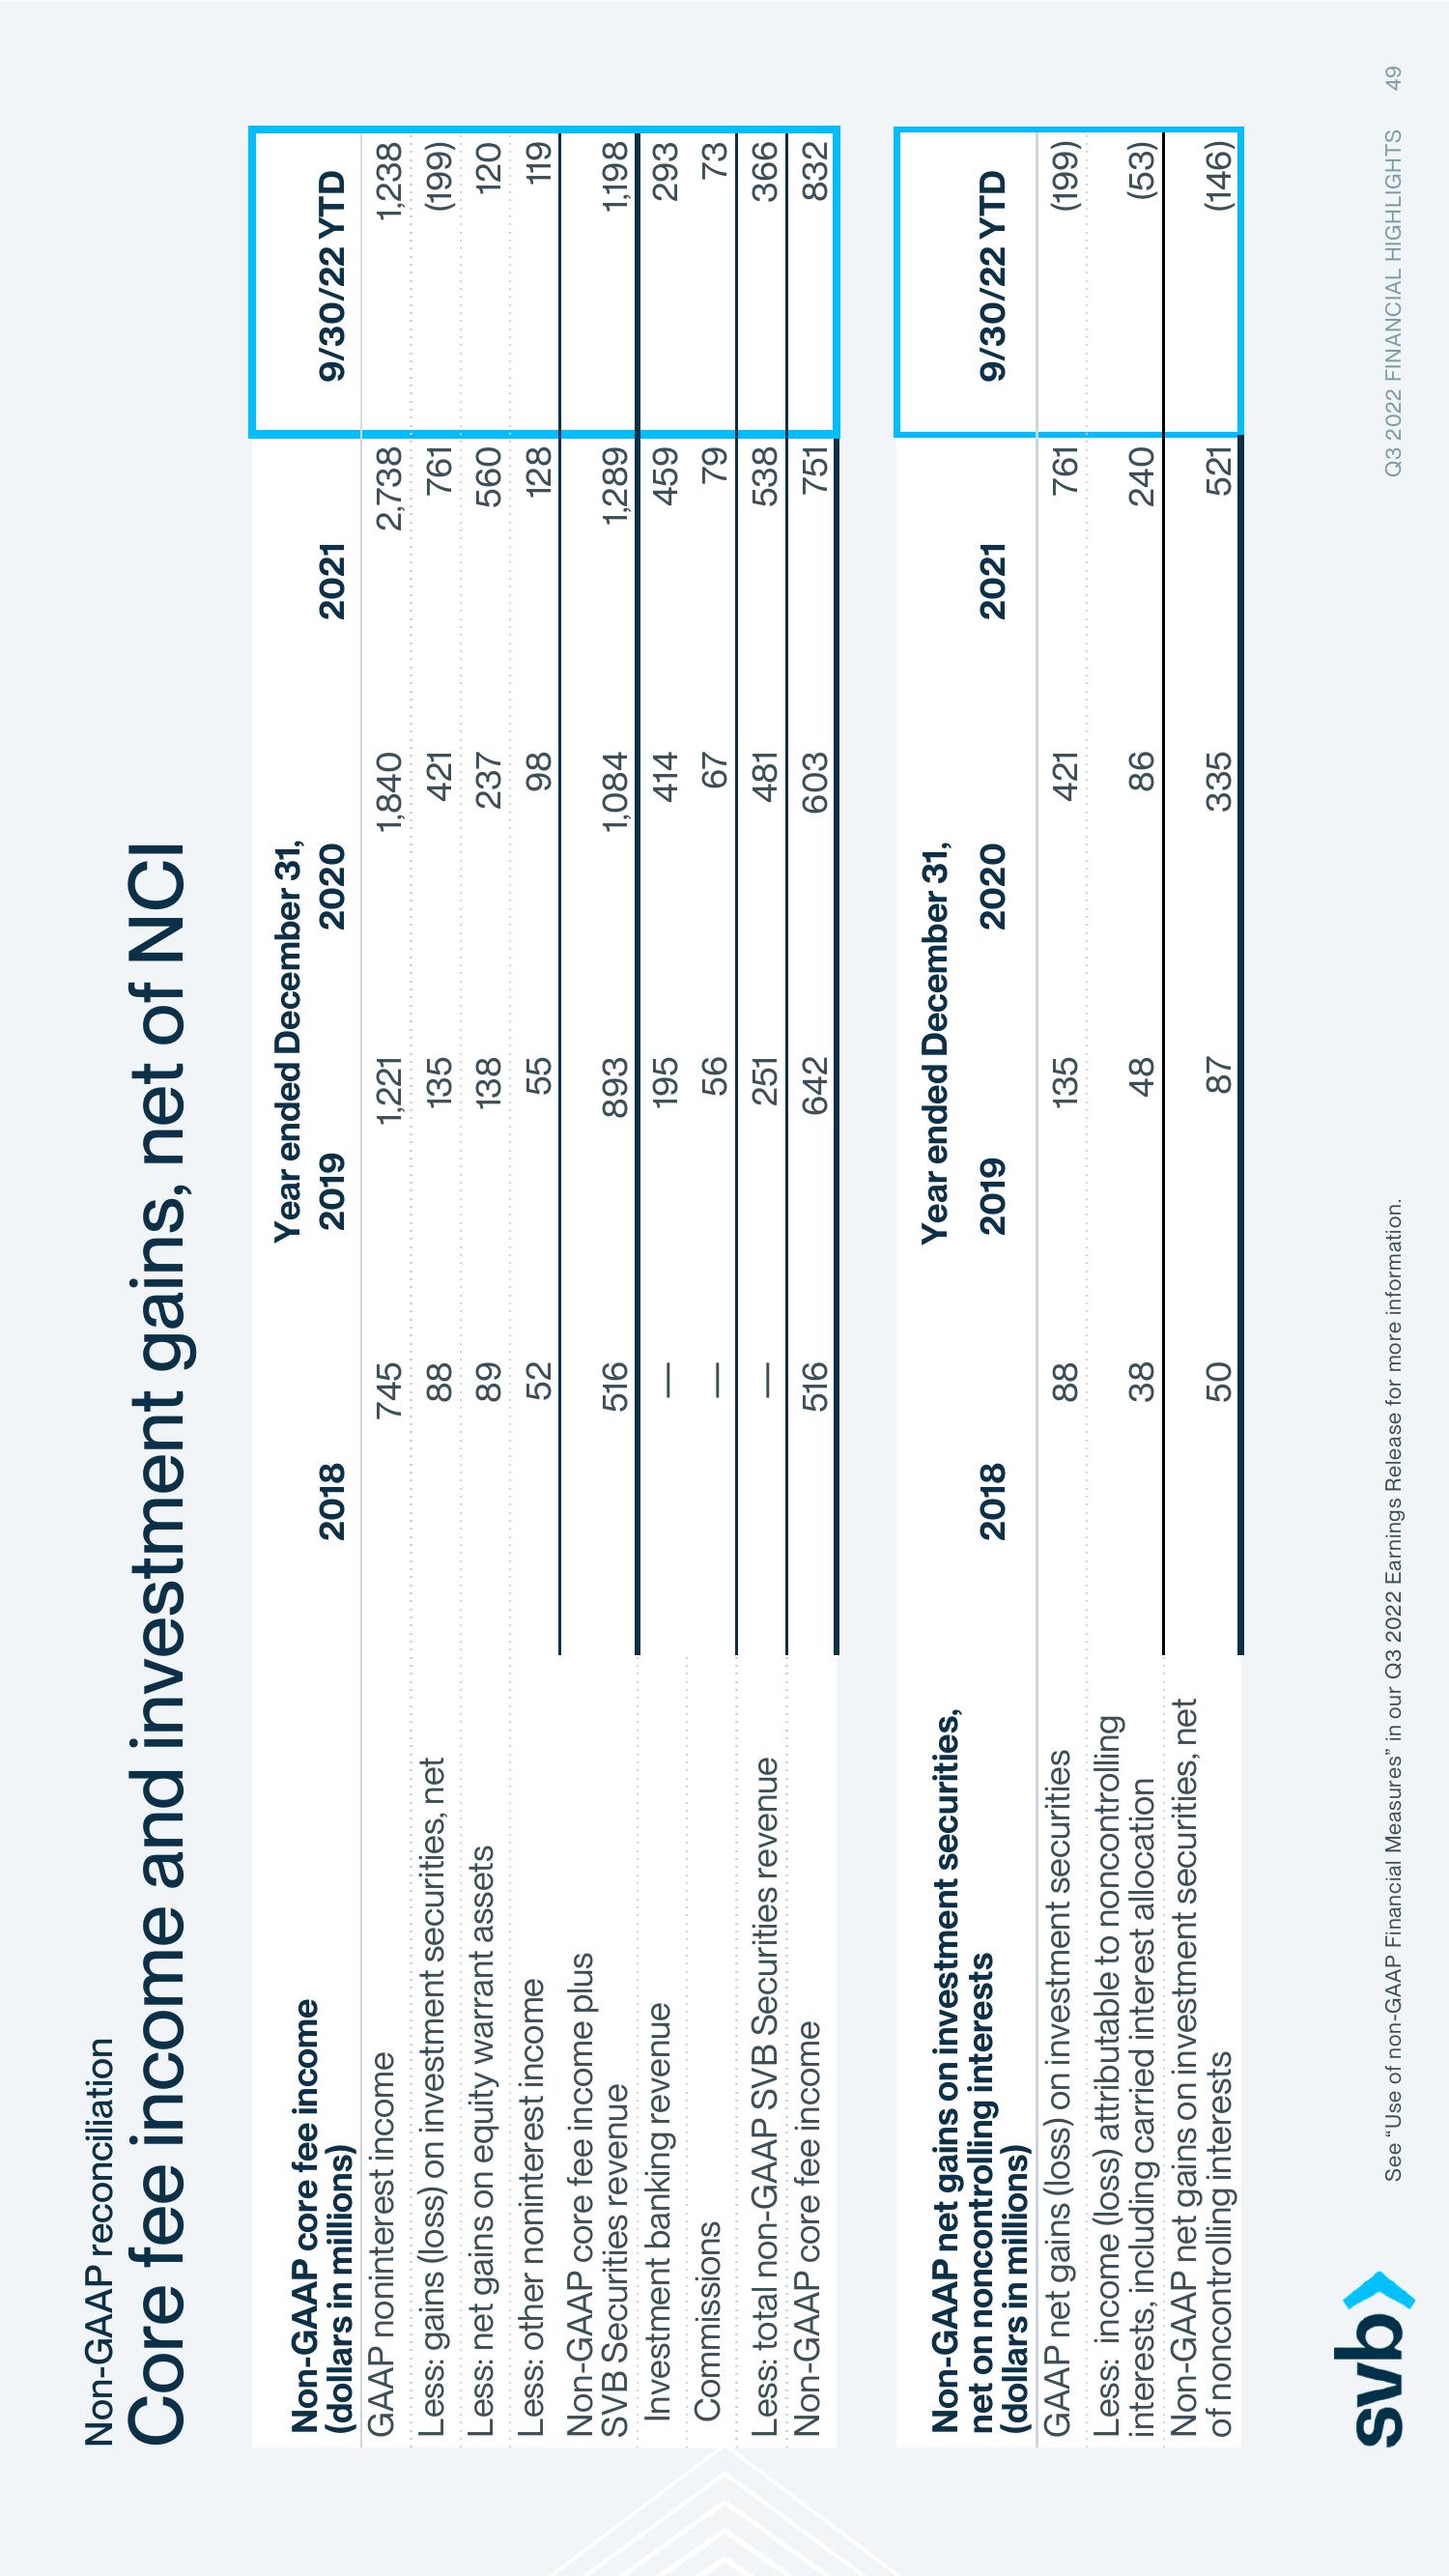
Core fee income and investment gains, net of NCI
Non-GAAP core fee income
(dollars in millions)
GAAP noninterest income
Less: gains (loss) on investment securities, net
Less: net gains on equity warrant assets
Less: other noninterest income
Non-GAAP core fee income plus
SVB Securities revenue
Investment banking revenue
Commissions
Less: total non-GAAP SVB Securities revenue
Non-GAAP core fee income
Non-GAAP net gains on investment securities,
net on noncontrolling interests
(dollars in millions)
GAAP net gains (loss) on investment securities
Less: income (loss) attributable to noncontrolling
interests, including carried interest allocation
Non-GAAP net gains on investment securities, net
of noncontrolling interests
svb>
2018
2018
745
88
89
52
516
516
88
38
50
Year ended December 31,
2019
2020
1,221
135
138
55
See "Use of non-GAAP Financial Measures" in our Q3 2022 Earnings Release for more information.
893
195
56
251
642
Year ended December 31,
2019
2020
135
48
87
1,840
421
237
98
1,084
414
67
481
603
421
86
335
2021
2021
2,738
761
560
128
1,289
459
79
538
751
761
240
521
9/30/22 YTD
1,238
(199)
120
119
1,198
293
73
366
832
9/30/22 YTD
(199)
(53)
(146)
Q3 2022 FINANCIAL HIGHLIGHTS 49View entire presentation