PJT Partners Investment Banking Pitch Book
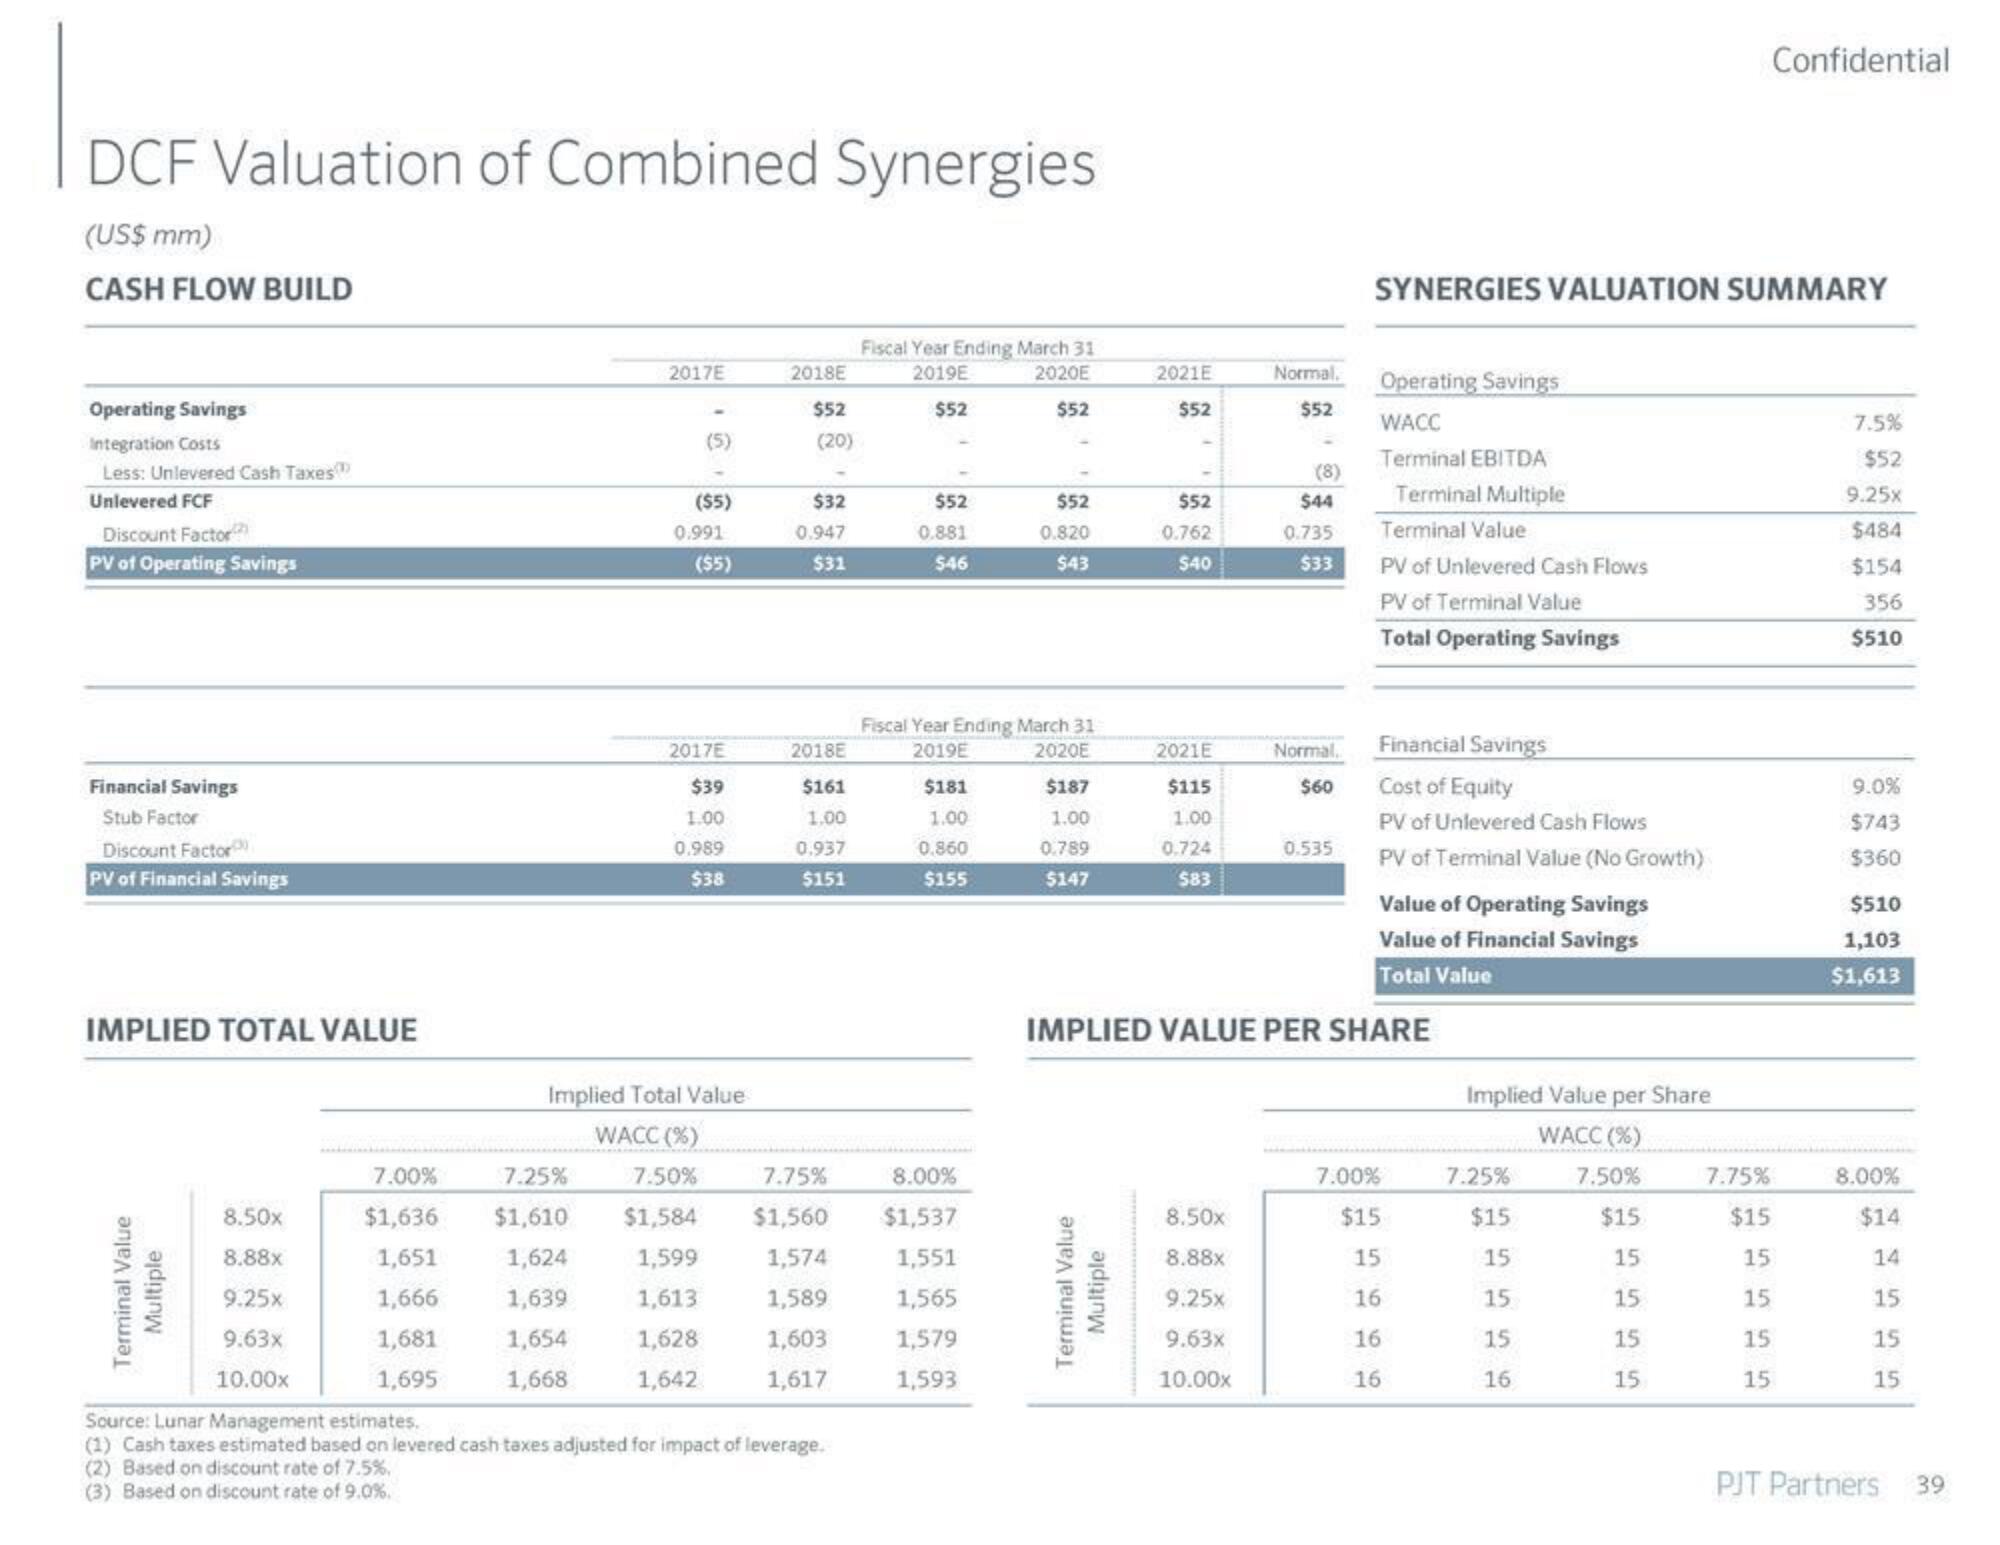
DCF Valuation of Combined Synergies
(US$ mm)
CASH FLOW BUILD
Operating Savings
Integration Costs
Less: Unlevered Cash Taxes
Unlevered FCF
Discount Factor
PV of Operating Savings
Financial Savings
Stub Factor
Discount Factor
PV of Financial Savings
IMPLIED TOTAL VALUE
Terminal Value
Multiple
8.50x
8.88x
9.25x
9.63x
10.00x
7.00%
$1,636
1,651
1,666
1,681
1,695
2017E
(5)
($5)
0.991
($5)
2017E
$39
1.00
0.989
$38
2018E
$52
(20)
$32
0.947
$31
2018E
$161
1.00
0.937
$151
Fiscal Year Ending March 31
2019E
2020E
$52
$52
Source: Lunar Management estimates.
(1) Cash taxes estimated based on levered cash taxes adjusted for impact of leverage.
(2) Based on discount rate of 7.5%.
(3) Based on discount rate of 9.0%.
$52
0.881
$46
Fiscal Year Ending March 31
2019E
2020E
$181
1.00
0.860
$155
Implied Total Value
WACC (%)
7.25%
8.00%
7.50% 7.75%
$1,610 $1,584 $1,560 $1,537
1,624
1,599
1,574
1,551
1,639
1,613
1,589
1,565
1,654
1,628
1,603
1,579
1,668
1,642
1,617
1,593
$52
0.820
$43
$187
1.00
0.789
$147
2021E
$52
Terminal Value
Multiple
$52
0.762
$40
2021E
$115
1.00
0.724
$83
Normal.
$52
8.50x
8.88x
9.25x
9.63x
10.00x
(8)
$44
0.735
$33
Normal.
$60
0.535
SYNERGIES VALUATION SUMMARY
Operating Savings
WACC
Terminal EBITDA
Terminal Multiple
Terminal Value
PV of Unlevered Cash Flows
PV of Terminal Value
Total Operating Savings
Financial Savings
Cost of Equity
PV of Unlevered Cash Flows
PV of Terminal Value (No Growth)
IMPLIED VALUE PER SHARE
Value of Operating Savings
Value of Financial Savings
Total Value
7.00%
$15
15
16
16
16
Implied Value per Share
WACC (%)
7.50%
$15
15
15
15
15
Confidential
7.25%
$15
15
15
15
16
7.75%
$15
15
15
15
15
7.5%
$52
9.25x
$484
$154
356
$510
9.0%
$743
$360
$510
1,103
$1,613
8.00%
$14
14
15
15
15
PJT Partners
39View entire presentation