Bird Investor Presentation Deck
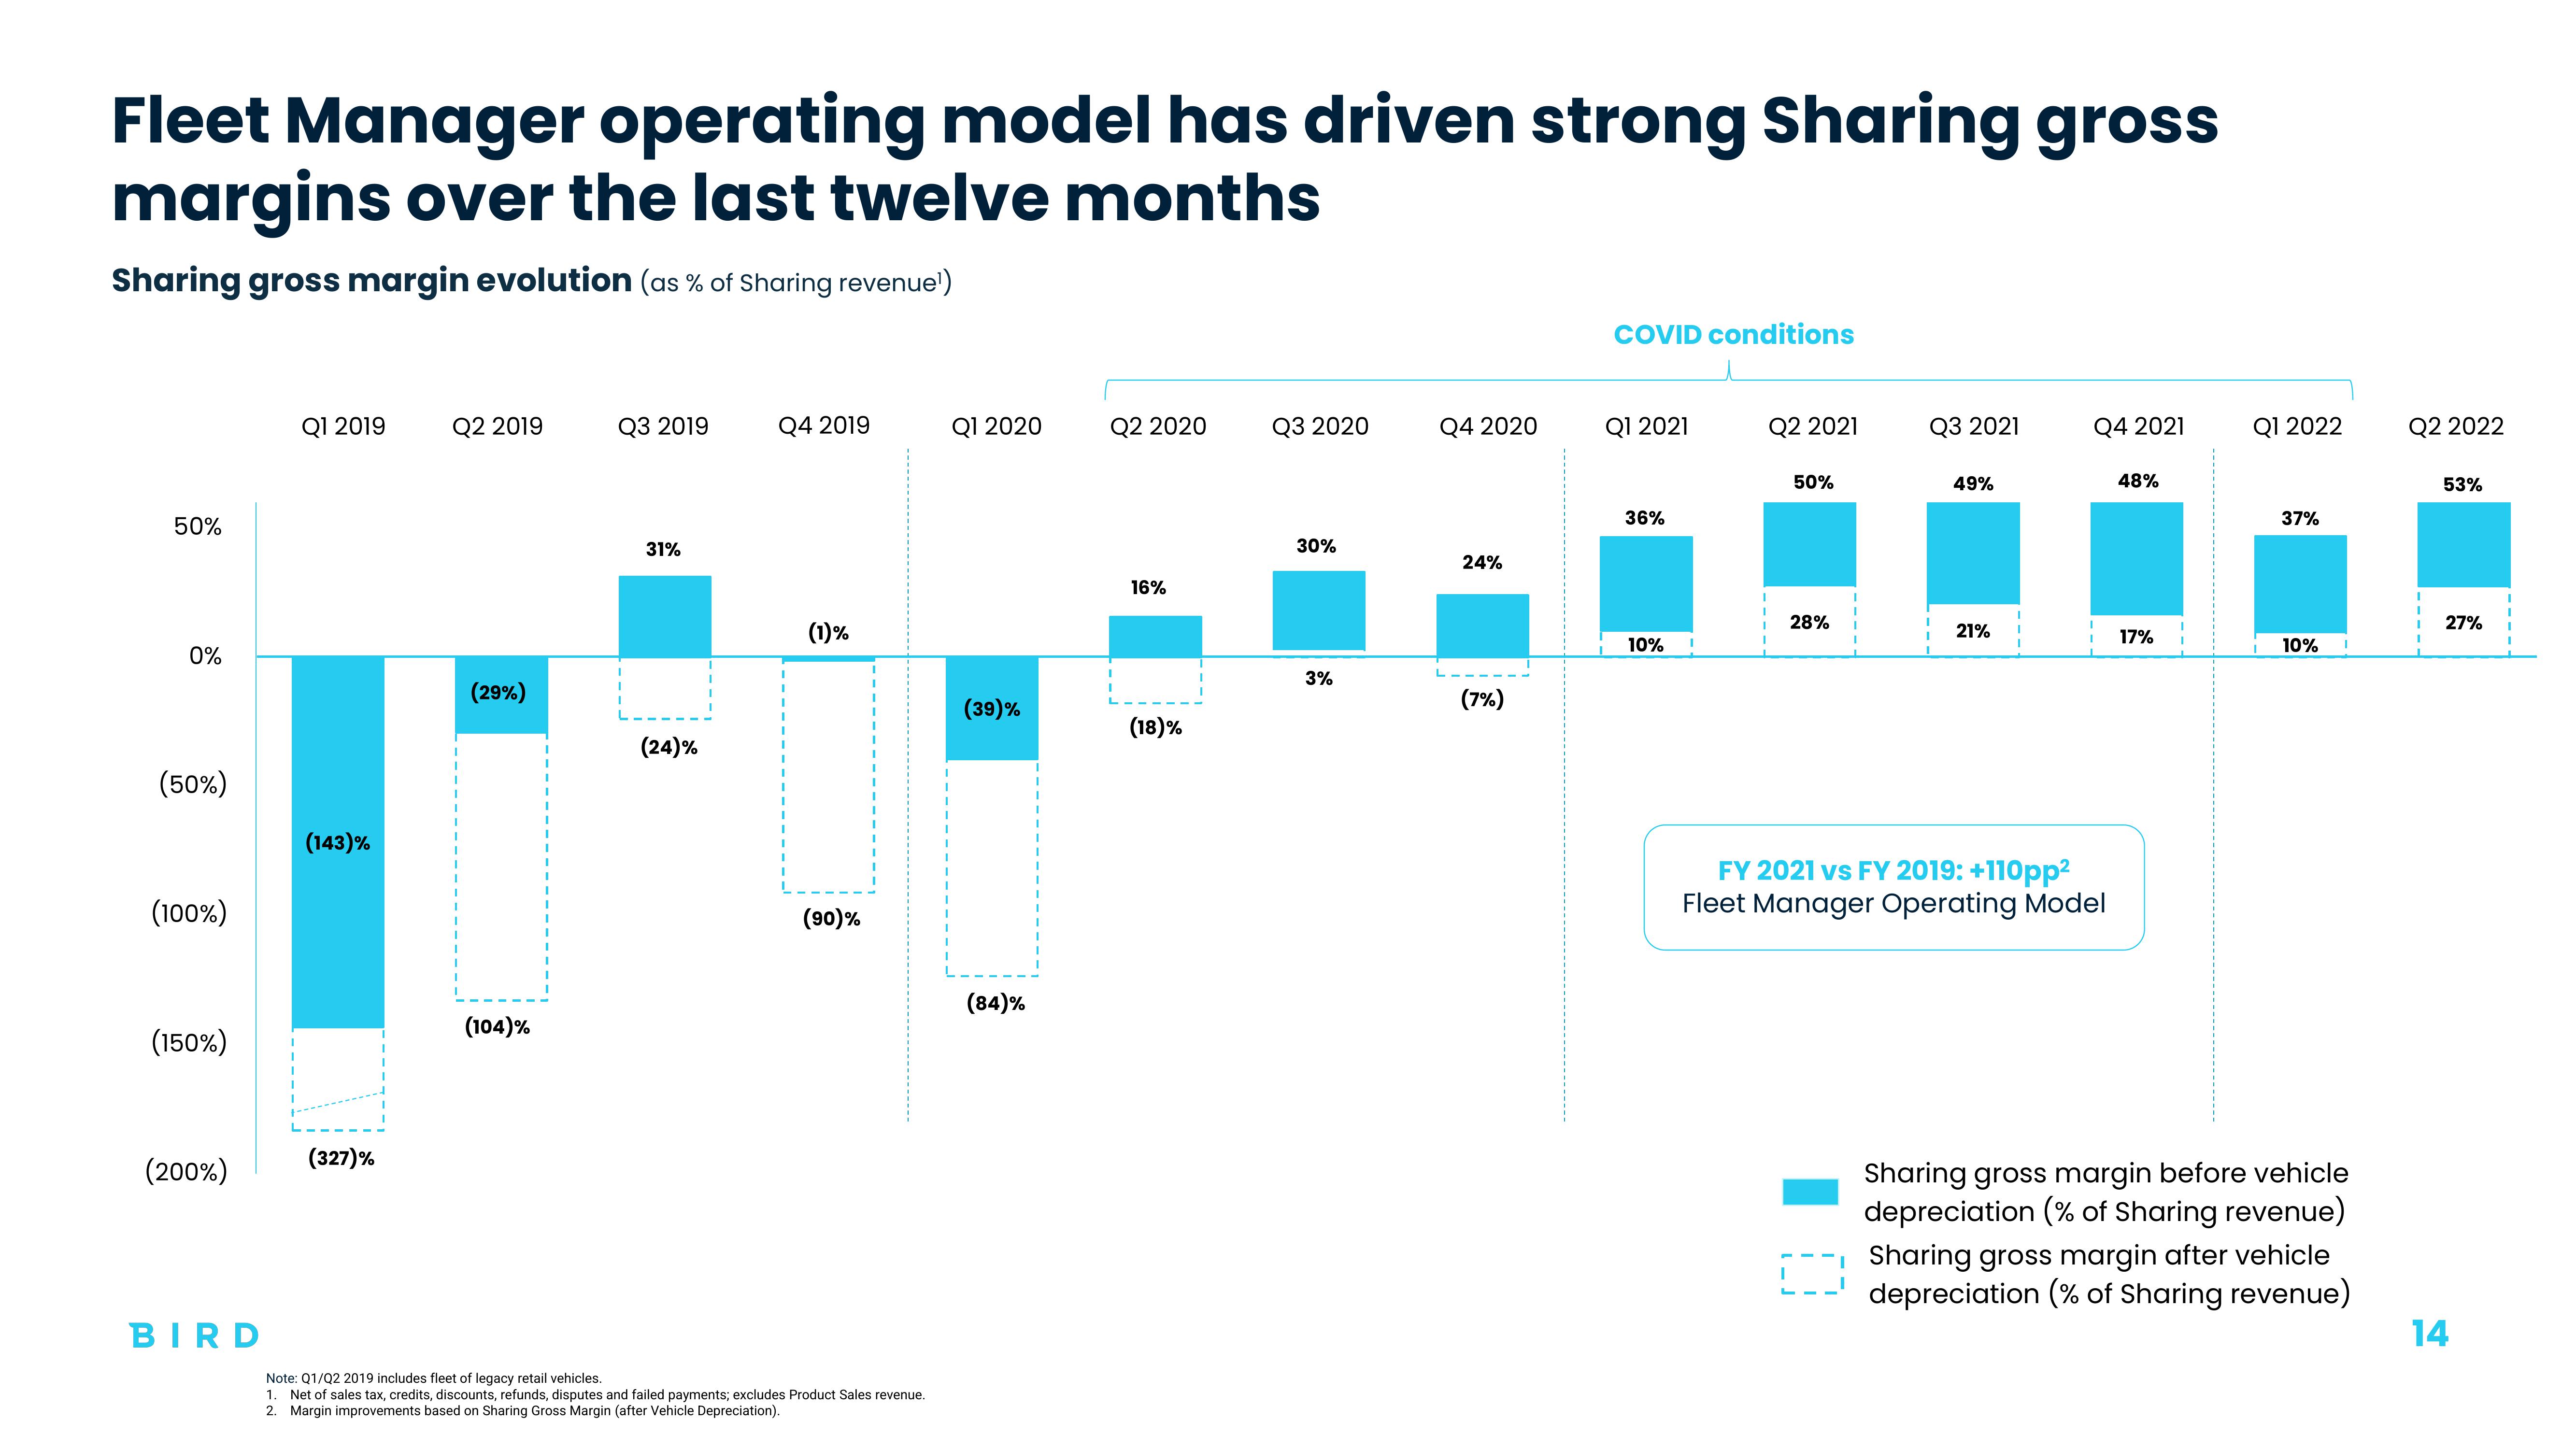
Fleet Manager operating model has driven strong Sharing gross
margins over the last twelve months
Sharing gross margin evolution (as % of Sharing revenue¹)
50%
0%
(50%)
(100%)
(150%)
(200%)
BIRD
Q1 2019
(143)%
(327)%
Q2 2019
(29%)
(104)%
Q3 2019
31%
(24)%
Q4 2019
(1)%
(90)%
Note: Q1/Q2 2019 includes fleet of legacy retail vehicles.
1. Net of sales tax, credits, discounts, refunds, disputes and failed payments; excludes Product Sales revenue.
2. Margin improvements based on Sharing Gross Margin (after Vehicle Depreciation).
Q1 2020
(39)%
(84)%
Q2 2020
16%
(18)%
Q3 2020
30%
3%
Q4 2020
24%
(7%)
COVID conditions
Q1 2021
36%
10%
Q2 2021
50%
28%
Q3 2021
49%
21%
Q4 2021
FY 2021 vs FY 2019: +110pp²
Fleet Manager Operating Model
48%
17%
Q1 2022
37%
10%
Sharing gross margin before vehicle
depreciation (% of Sharing revenue)
Sharing gross margin after vehicle
depreciation (% of Sharing revenue)
Q2 2022
53%
27%
14View entire presentation