Flutter Results Presentation Deck
US
Pro forma £m
Average monthly players ('000s)
Sportsbook stakes
Sportsbook net revenue margin
Sports revenue
Gaming revenue
Total revenue
Cost of sales
Cost of sales as a % of net revenue
Gross profit
Sales & marketing costs
Contribution
Other operating costs
Adjusted EBITDA
Adjusted EBITDA margin
Depreciation and amortisation
Adjusted operating profit
Flutter
FY 2021
1,557
11,284
6.3%
978
413
1,391
(614)
44.1%
778
(663)
115
(357)
(243)
(17.5%)
(47)
(289)
FY 2020
910
4,411
4.6%
458
237
695
(319)
46.0%
376
(348)
28
(198)
(170)
(24.4%)
(37)
(207)
YOY
+71%
+156%
+170bps
+113%
+74%
+100%
+92%
-190bps
+107%
+91%
+310%
+81%
+43%
+700bps
+26%
+40%
YOY CC
+167%
+170bps
+126%
+87%
+113%
+104%
-190bps
+121%
+102%
+383%
+92%
+50%
+730bps
+35%
+47%
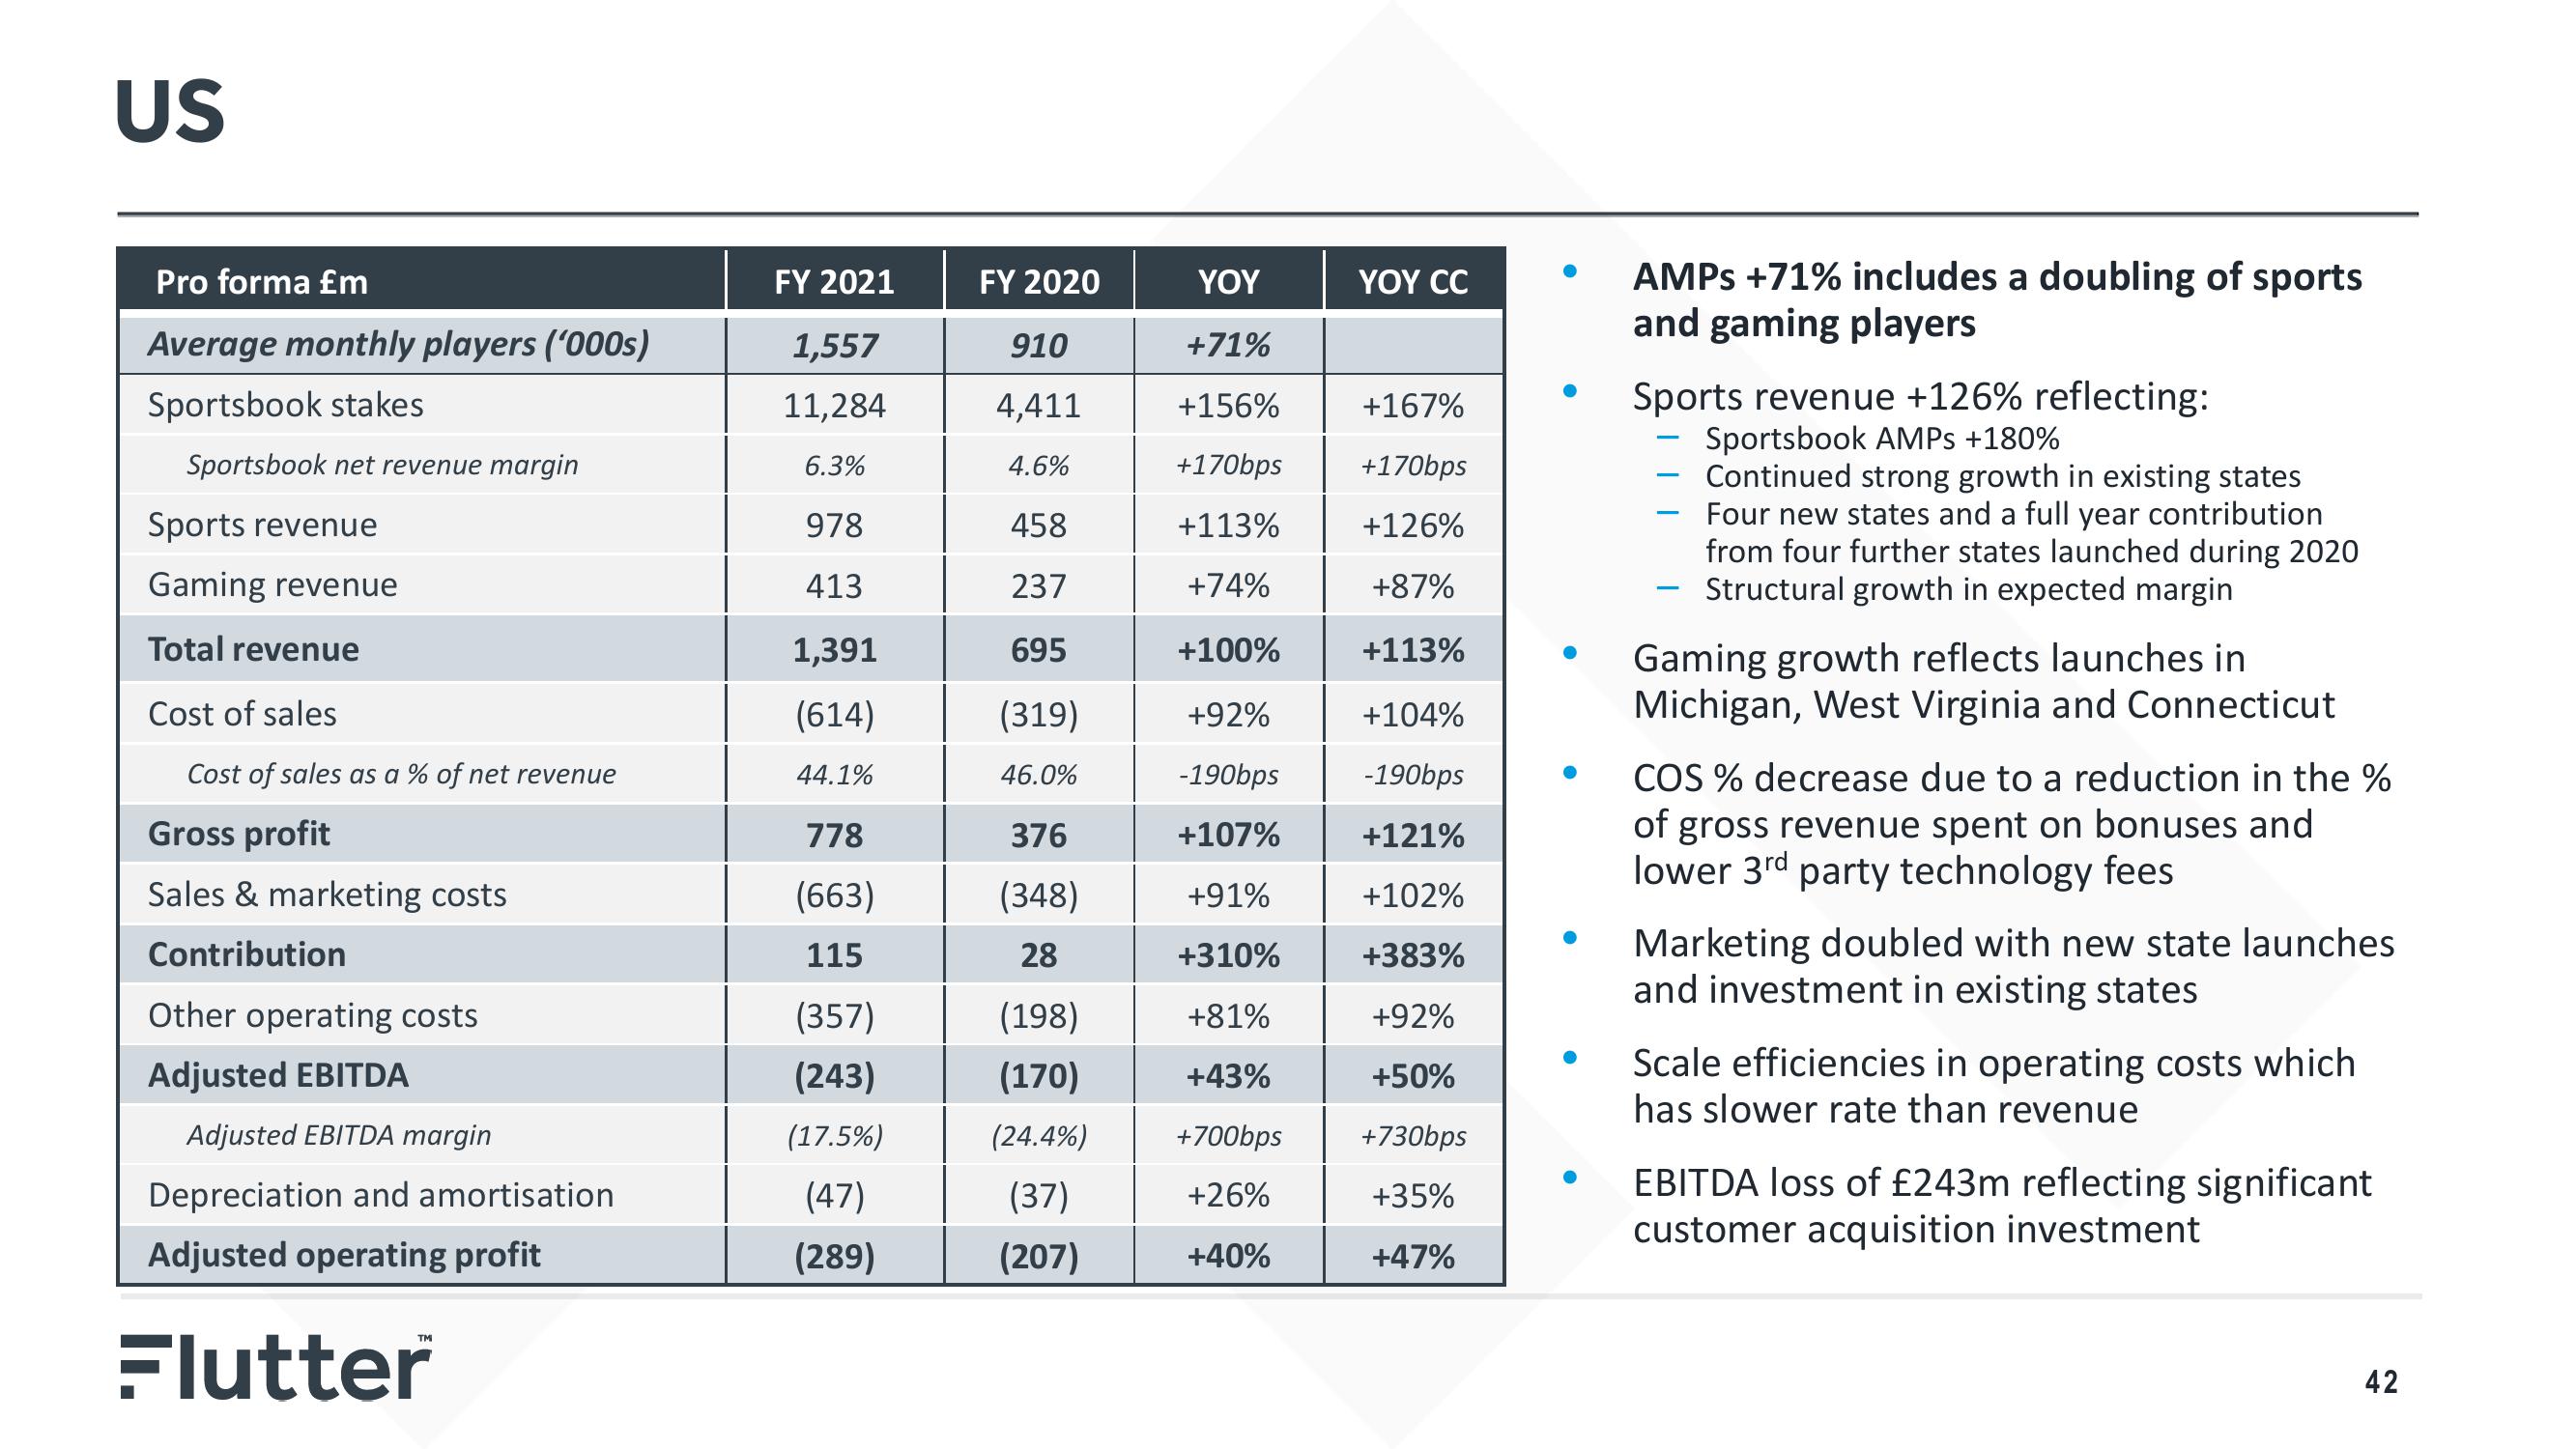
AMPS +71% includes a doubling of sports
and gaming players
Sports revenue +126% reflecting:
Sportsbook AMPS +180%
Continued strong growth in existing states
Four new states and a full year contribution
from four further states launched during 2020
Structural growth in expected margin
-
-
-
Gaming growth reflects launches in
Michigan, West Virginia and Connecticut
COS % decrease due to a reduction in the %
of gross revenue spent on bonuses and
lower 3rd party technology fees
Marketing doubled with new state launches
and investment in existing states
Scale efficiencies in operating costs which
has slower rate than revenue
EBITDA loss of £243m reflecting significant
customer acquisition investment
42View entire presentation