Marti Investor Presentation Deck
5. Strong unit economics (cont'd)
Improving unit economics
$1.12
2020A
Net revenue per ride
($)
$0.96
2021A
CAGR
+23%
$0.88
2022E
$1.28
2023E
1
$1.68
FD
$0.81
2020A
Net costs per ride²
($)
$0.65
2021A
CAGR
(11%)
$0.58
2022E
$0.71
2023E¹
$0.64
FD
$0.30
27%
Gross profit per ride³
($)
$0.31
32%
2020A 2021A
CAGR5
+85%
$0.29
33%
2022E
Gross profit per ride ($)
$0.57
45%
$1.04
62%
2023E¹ 2023FD
Better
margins and
cash position
Gross profit margin (%)
Lower
operating cost
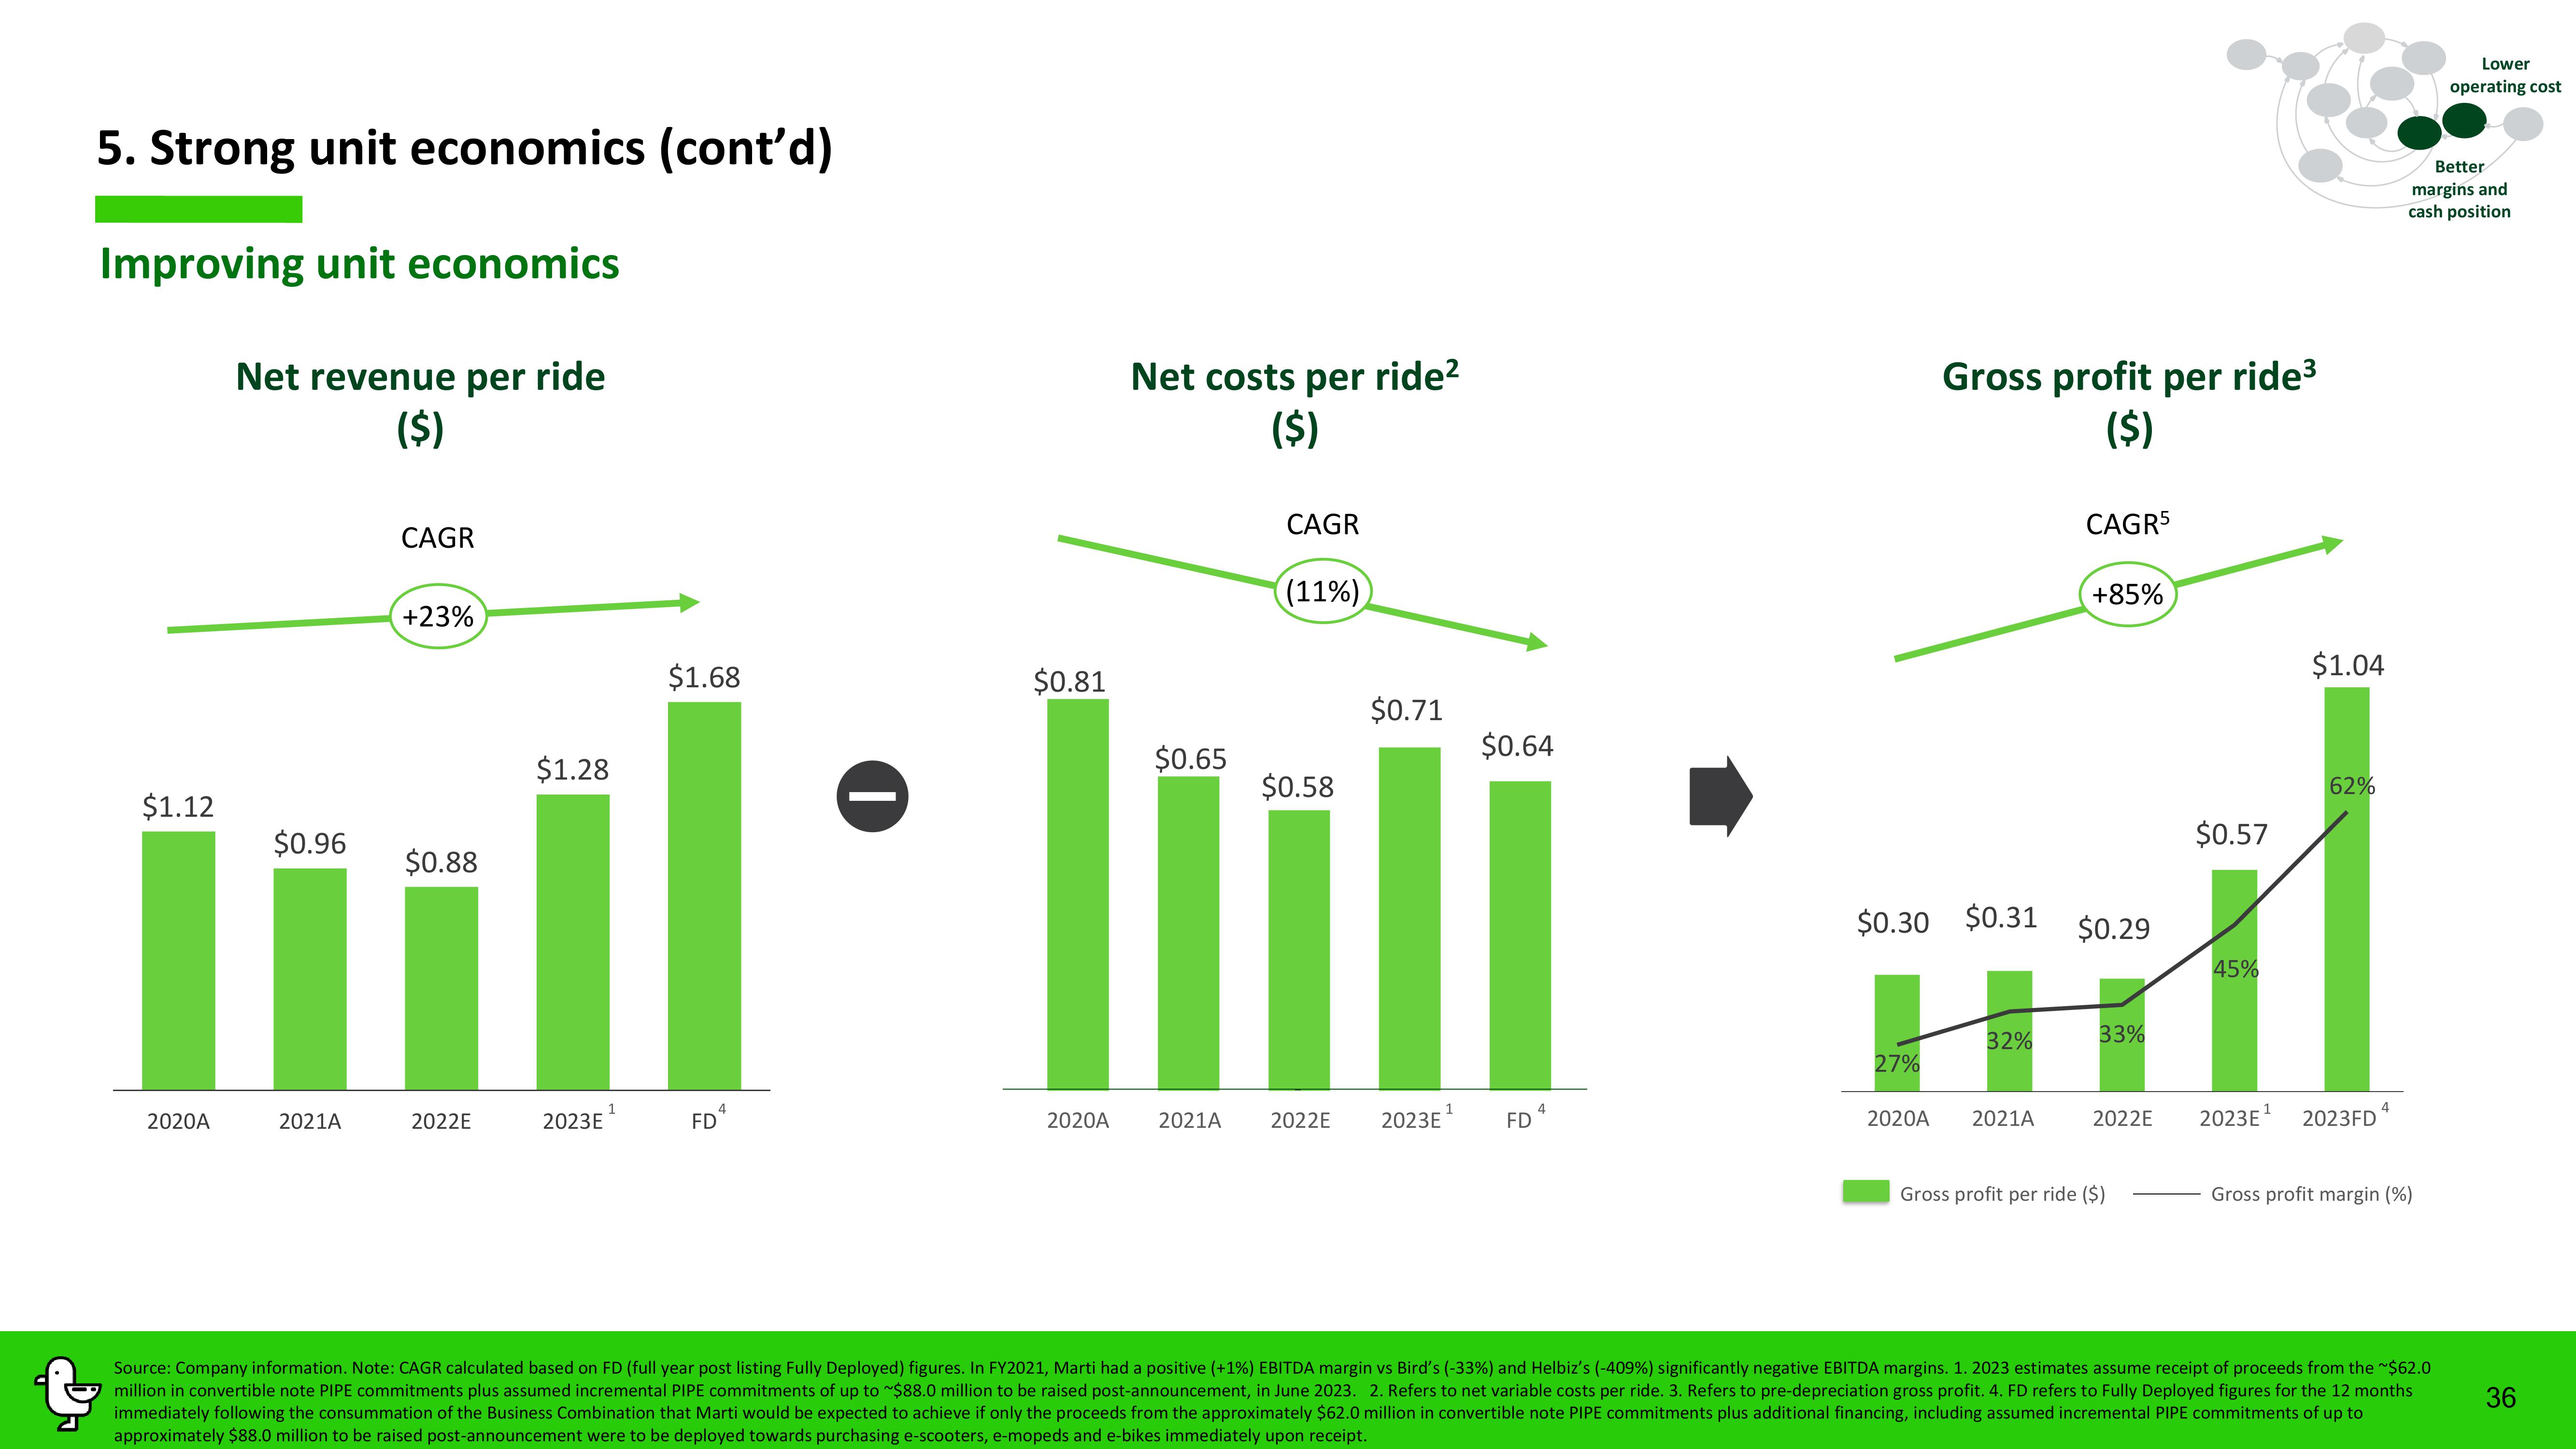
Source: Company information. Note: CAGR calculated based on FD (full year post listing Fully Deployed) figures. In FY2021, Marti had a positive (+1%) EBITDA margin vs Bird's (-33%) and Helbiz's (-409%) significantly negative EBITDA margins. 1. 2023 estimates assume receipt of proceeds from the ~$62.0
million in convertible note PIPE commitments plus assumed incremental PIPE commitments of up to $88.0 million to be raised post-announcement, in June 2023. 2. Refers to net variable costs per ride. 3. Refers to pre-depreciation gross profit. 4. FD refers to Fully Deployed figures for the 12 months
immediately following the consummation of the Business Combination that Marti would be expected to achieve if only the proceeds from the approximately $62.0 million in convertible note PIPE commitments plus additional financing, including assumed incremental PIPE commitments of up to
approximately $88.0 million to be raised post-announcement were to be deployed towards purchasing e-scooters, e-mopeds and e-bikes immediately upon receipt.
36View entire presentation