Lyft Results Presentation Deck
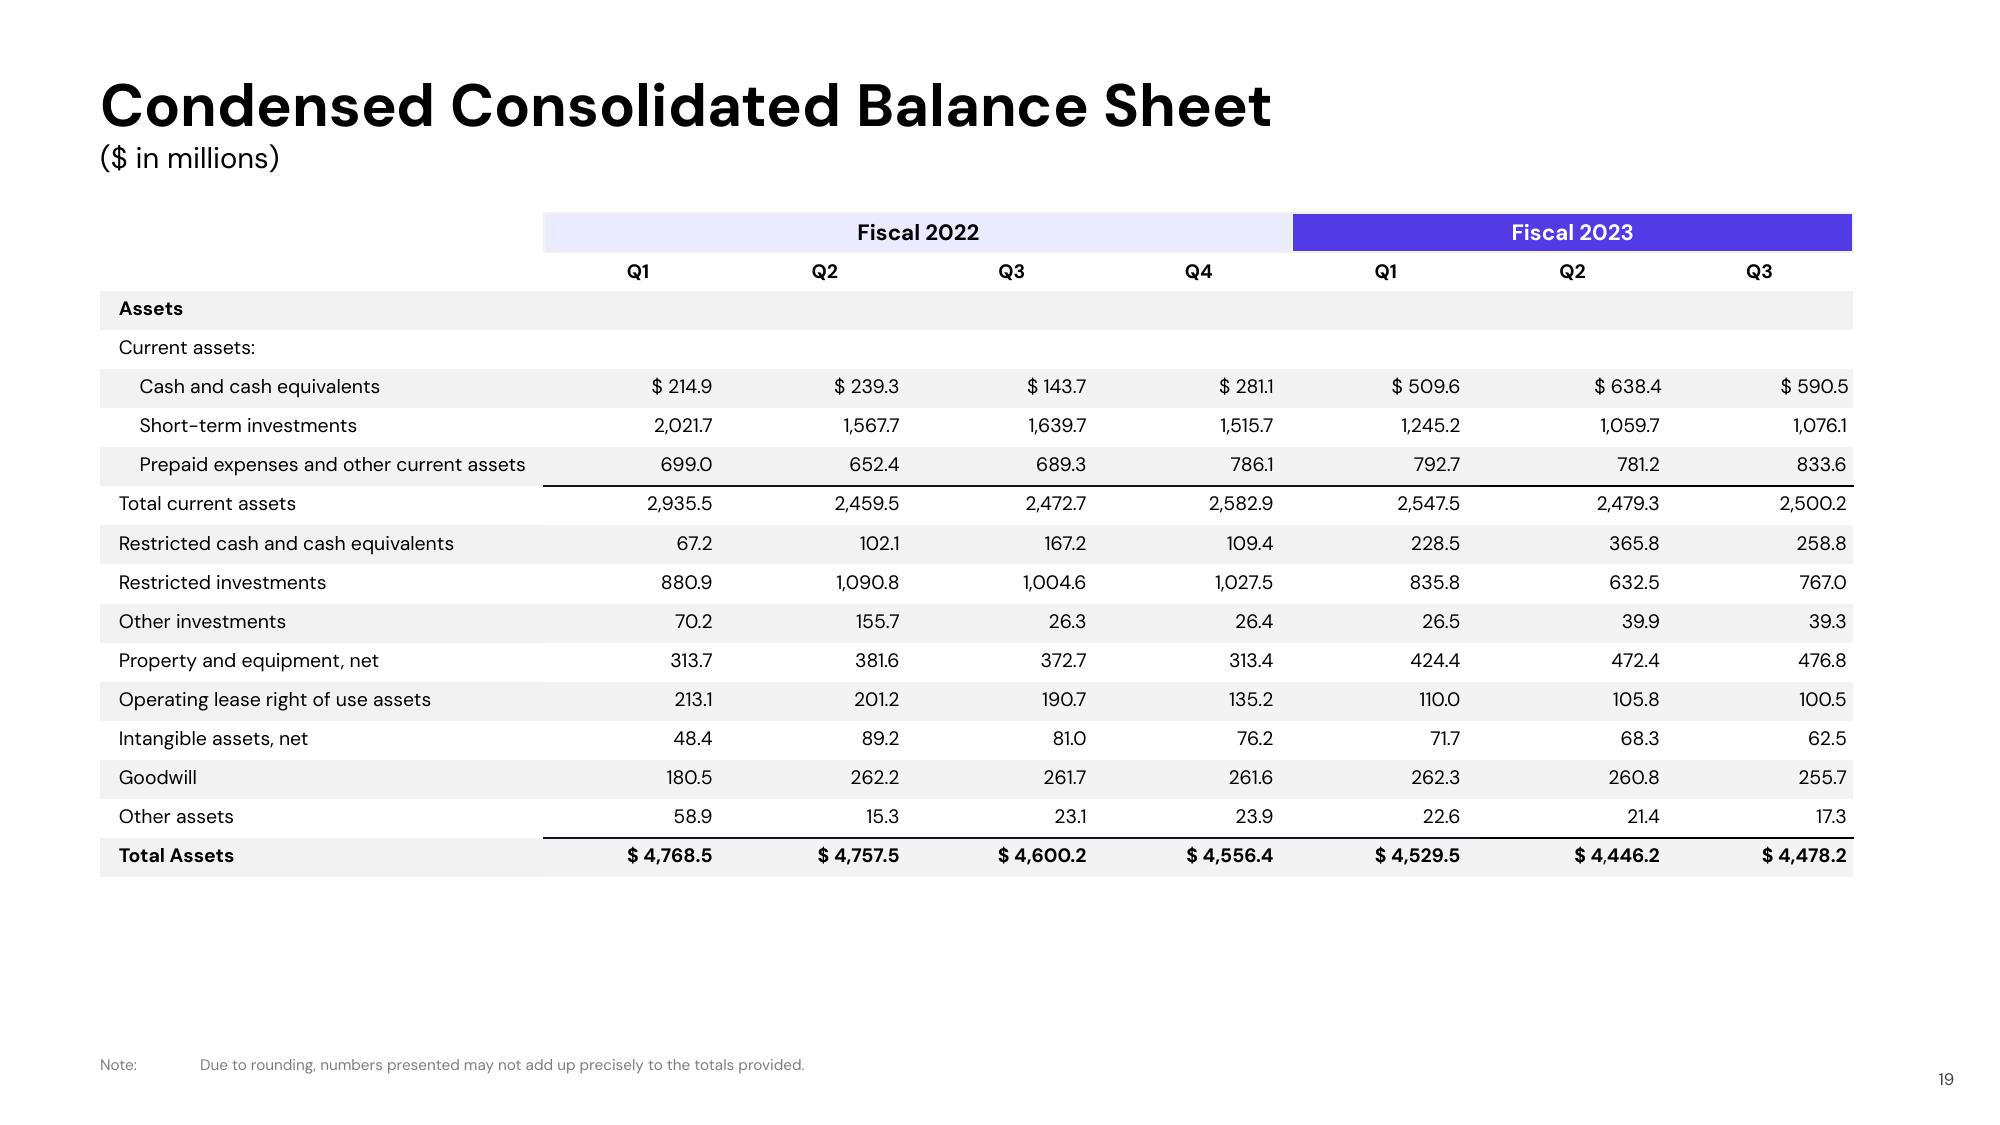
Condensed Consolidated Balance Sheet
($ in millions)
Assets
Current assets:
Cash and cash equivalents
Short-term investments
Prepaid expenses and other current assets
Total current assets
Restricted cash and cash equivalents
Restricted investments
Other investments
Property and equipment, net
Operating lease right of use assets
Intangible assets, net
Goodwill
Other assets
Total Assets
Note:
Q1
$ 214.9
2,021.7
699.0
2,935.5
67.2
880.9
70.2
313.7
213.1
48.4
180.5
58.9
$ 4,768.5
Due to rounding, numbers presented may not add up precisely to the totals provided.
Q2
Fiscal 2022
$ 239.3
1,567.7
652.4
2,459.5
102.1
1,090.8
155.7
381.6
201.2
89.2
262.2
15.3
$4,757.5
Q3
$143.7
1,639.7
689.3
2,472.7
167.2
1,004.6
26.3
372.7
190.7
81.0
261.7
23.1
$ 4,600.2
Q4
$281.1
1,515.7
786.1
2,582.9
109.4
1,027.5
26.4
313.4
135.2
76.2
261.6
23.9
$ 4,556.4
Q1
$ 509.6
1,245.2
792.7
2,547.5
228.5
835.8
26.5
424.4
110.0
71.7
262.3
22.6
$ 4,529.5
Fiscal 2023
Q2
$638.4
1,059.7
781.2
2,479.3
365.8
632.5
39.9
472.4
105.8
68.3
260.8
21.4
$ 4,446.2
Q3
$590.5
1,076.1
833.6
2,500.2
258.8
767.0
39.3
476.8
100.5
62.5
255.7
17.3
$ 4,478.2
19View entire presentation