Anghami SPAC Presentation Deck
Strong and Resilient Revenue Growth Coupled with Clear Path
to Sustainable Profitability
(USD MM)
17.0
4.6
12.4
2017
~20% CAGR FY17 - FY21
22.1
5.5
16.6
Total Revenue
2018
31.2
8.0
23.2
2019
30.5
5.8
24.7
2020
9.0
26.1
2021
(2)
[36.1]
[35.1]
(USD MM)
10%
1.6
2017
-57% CAGR FY17- FY21
21%
4.7
Gross Profit
2018
32%
9.9
2019
27%
8.2
2020
27%
9.6
2021
(2)
Gross Profit
Gross Margin %
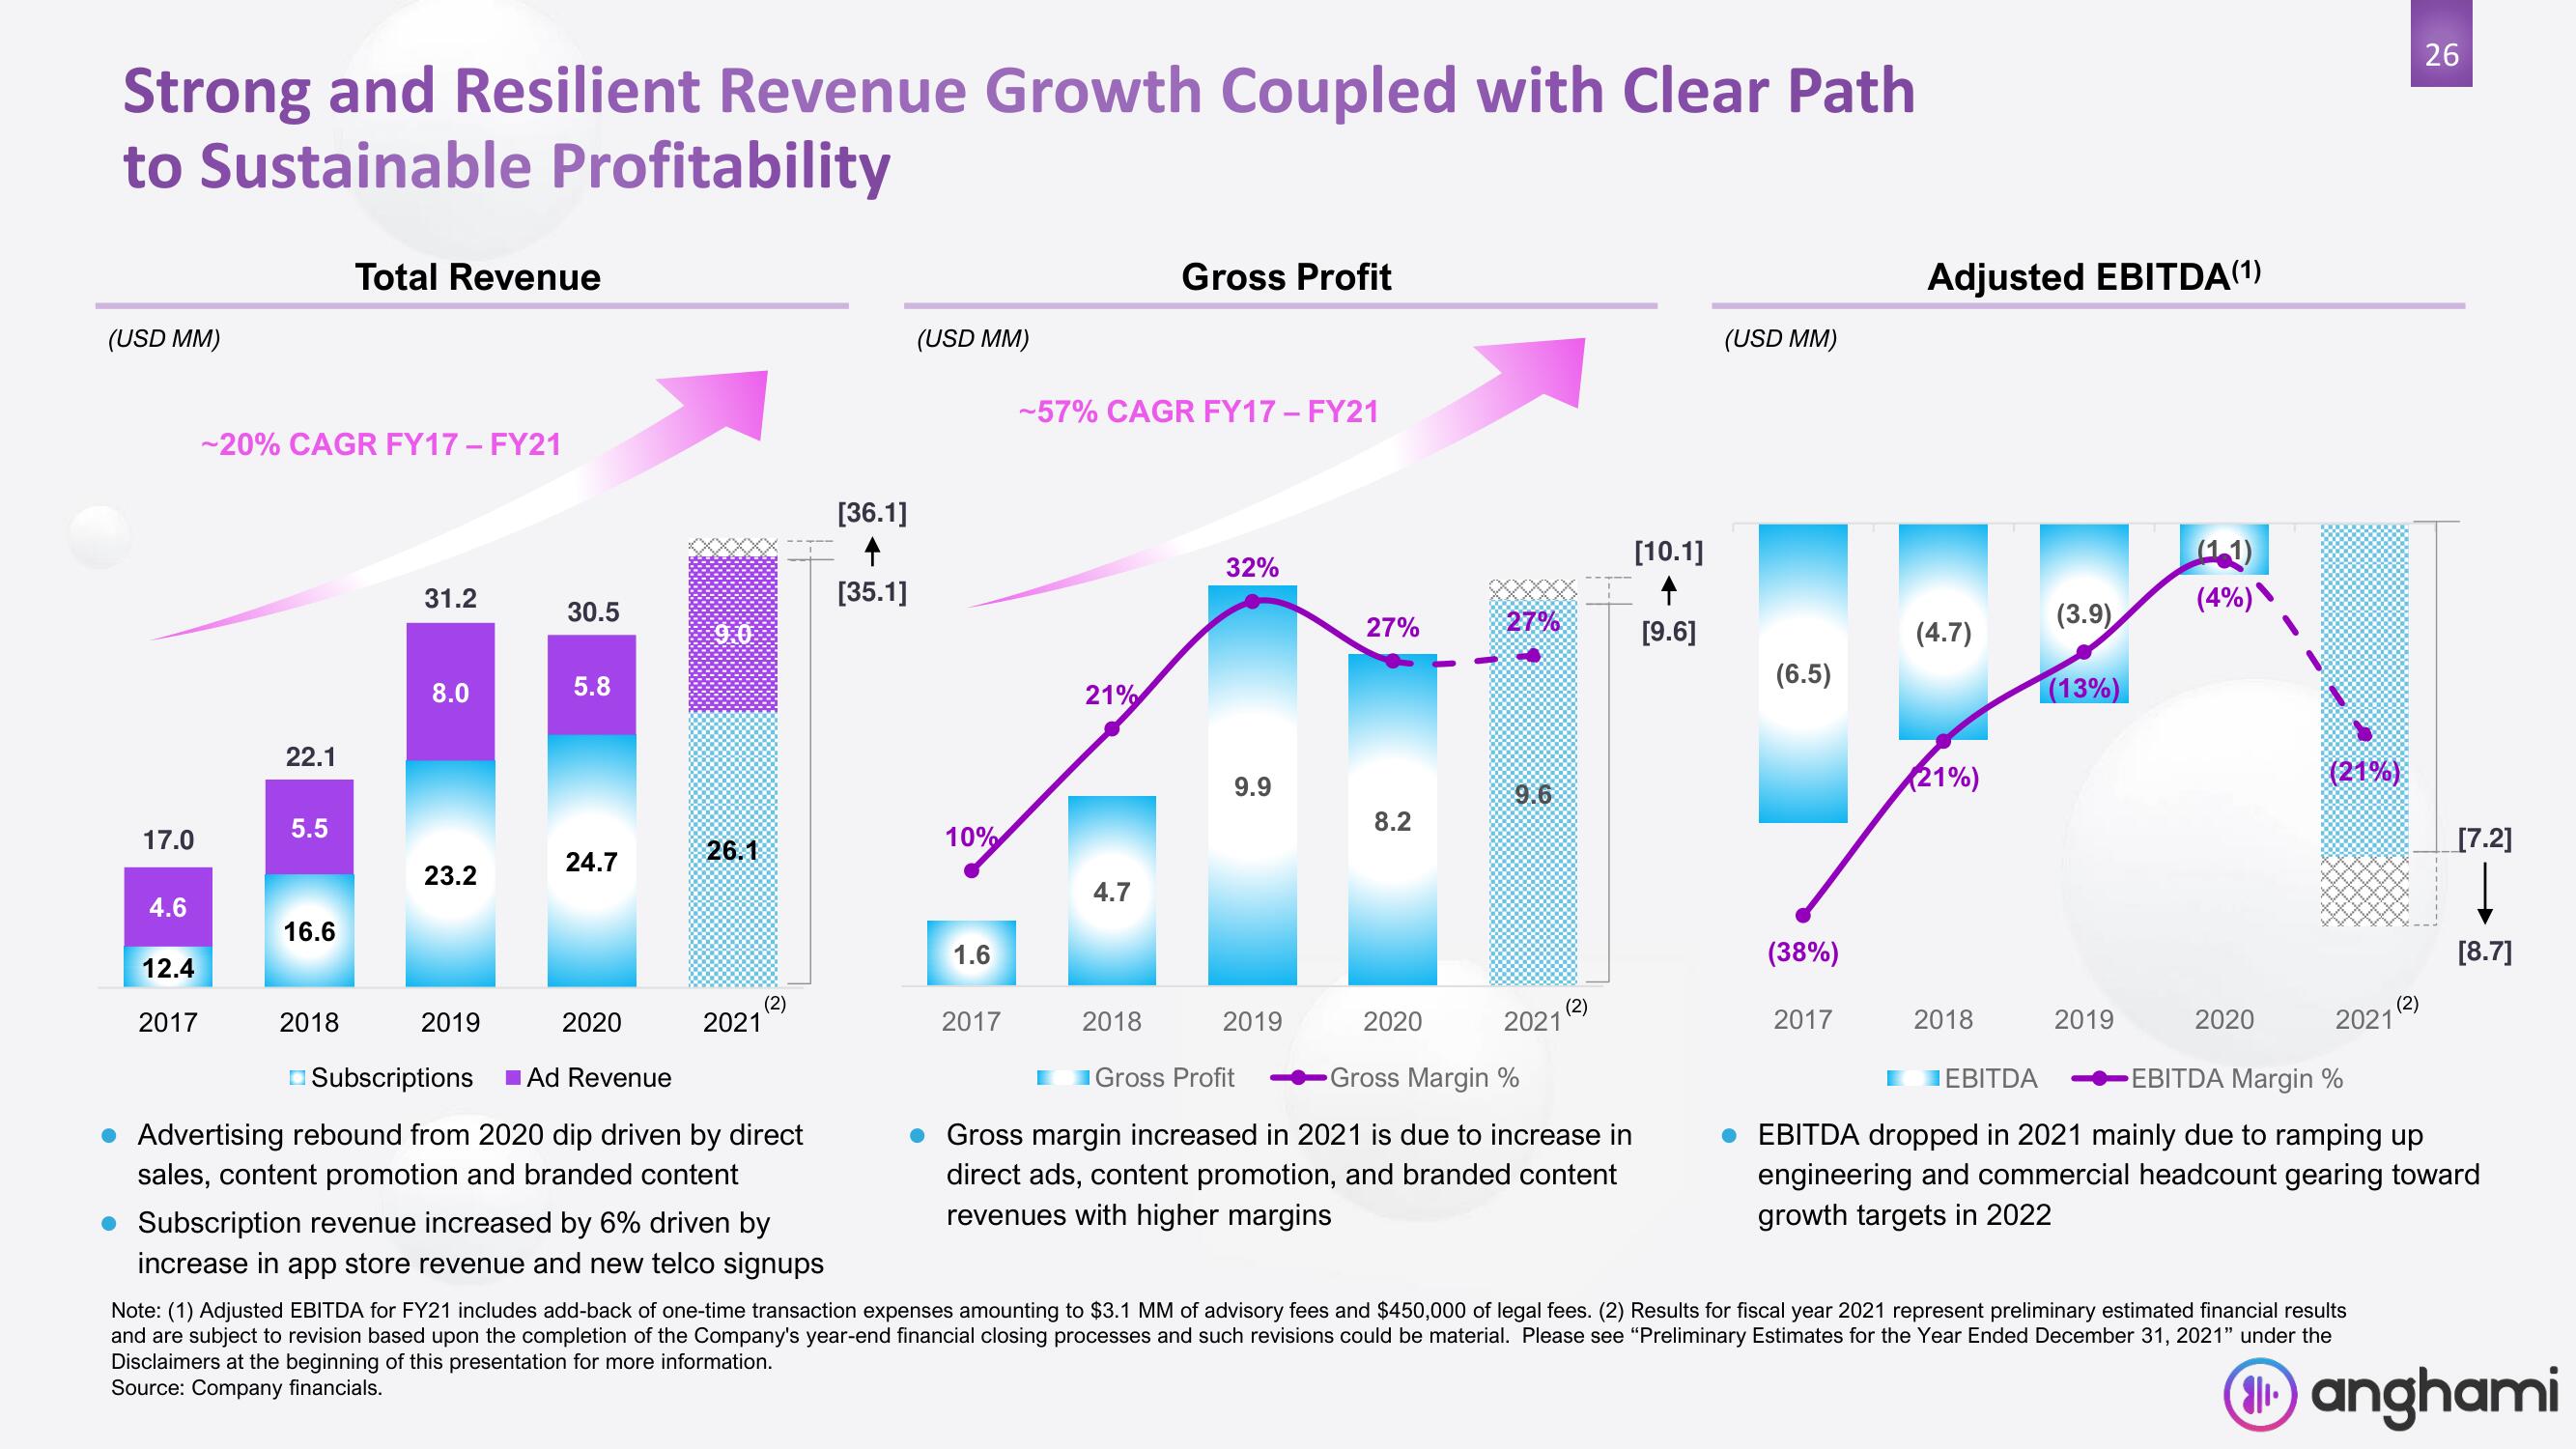
Gross margin increased in 2021 is due to increase in
direct ads, content promotion, and branded content
revenues with higher margins
[10.1]
[9.6]
(USD MM)
(6.5)
(38%)
2017
Adjusted EBITDA(1)
(4.7)
(21%)
2018
(3.9)
(13%)
2019
(1.1)
(4%)
2020
(21%)
2021
(2)
26
[7.2]
Į
[8.7]
EBITDA
EBITDA Margin %
EBITDA dropped in 2021 mainly due to ramping up
engineering and commercial headcount gearing toward
growth targets in 2022
Subscriptions Ad Revenue
Advertising rebound from 2020 dip driven by direct
sales, content promotion and branded content
Subscription revenue increased by 6% driven by
increase in app store revenue and new telco signups
Note: (1) Adjusted EBITDA for FY21 includes add-back of one-time transaction expenses amounting to $3.1 MM of advisory fees and $450,000 of legal fees. (2) Results for fiscal year 2021 represent preliminary estimated financial results
and are subject to revision based upon the completion of the Company's year-end financial closing processes and such revisions could be material. Please see "Preliminary Estimates for the Year Ended December 31, 2021" under the
Disclaimers at the beginning of this presentation for more information.
Source: Company financials.
11anghamiView entire presentation