Wix Results Presentation Deck
due to strong adoption of our vertical applications and continued improvement
in conversion. Our growth in the US is even more impressive given our scale
with over 50% of our revenue coming from the US.
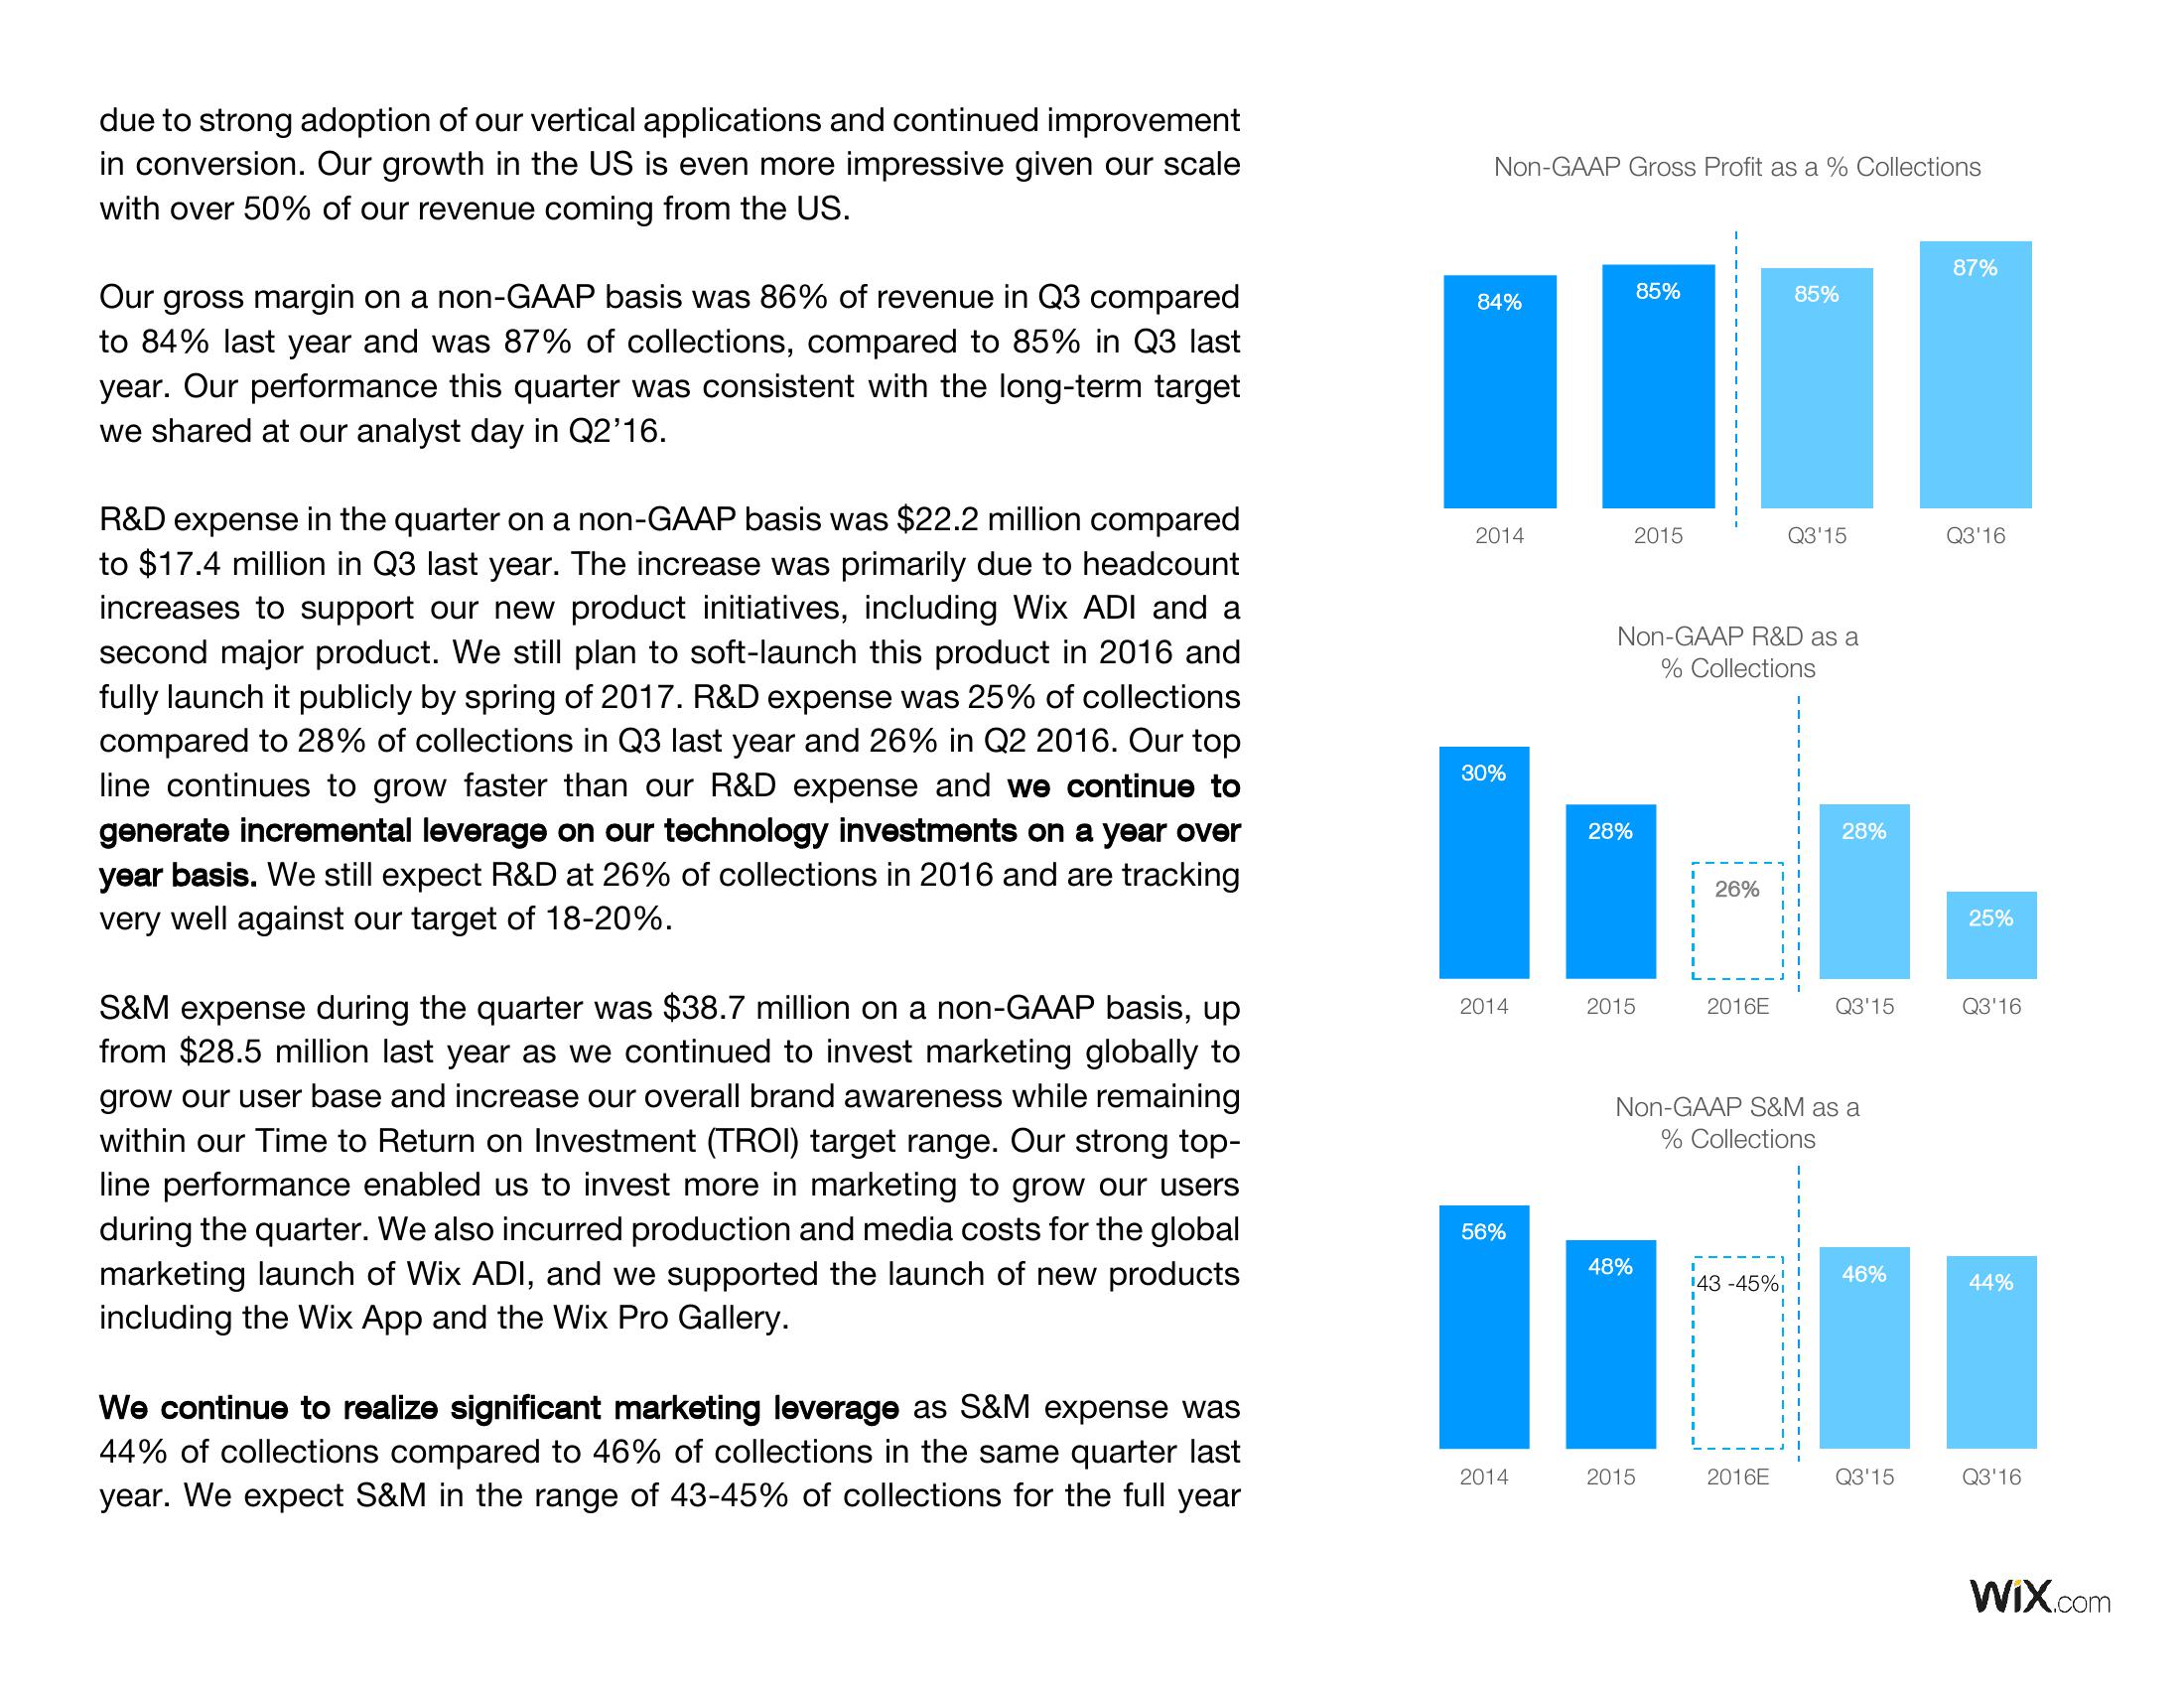
Our gross margin on a non-GAAP basis was 86% of revenue in Q3 compared
to 84% last year and was 87% of collections, compared to 85% in Q3 last
year. Our performance this quarter was consistent with the long-term target
we shared at our analyst day in Q2'16.
R&D expense in the quarter on a non-GAAP basis was $22.2 million compared
to $17.4 million in Q3 last year. The increase was primarily due to headcount
increases to support our new product initiatives, including Wix ADI and a
second major product. We still plan to soft-launch this product in 2016 and
fully launch it publicly by spring of 2017. R&D expense was 25% of collections
compared to 28% of collections in Q3 last year and 26% in Q2 2016. Our top
line continues to grow faster than our R&D expense and we continue to
generate incremental leverage on our technology investments on a year over
year basis. We still expect R&D at 26% of collections in 2016 and are tracking
very well against our target of 18-20%.
S&M expense during the quarter was $38.7 million on a non-GAAP basis, up
from $28.5 million last year as we continued to invest marketing globally to
grow our user base and increase our overall brand awareness while remaining
within our Time to Return on Investment (TROI) target range. Our strong top-
line performance enabled us to invest more in marketing to grow our users
during the quarter. We also incurred production and media costs for the global
marketing launch of Wix ADI, and we supported the launch of new products
including the Wix App and the Wix Pro Gallery.
We continue to realize significant marketing leverage as S&M expense was
44% of collections compared to 46% of collections in the same quarter last
year. We expect S&M in the range of 43-45% of collections for the full year
Non-GAAP Gross Profit as a % Collections
84%
2014
30%
2014
56%
2014
28%
2015
85%
2015
Non-GAAP R&D as a
% Collections
48%
26%
2015
2016E
85%
143 -45%
Q3'15
Non-GAAP S&M as a
% Collections
2016E
28%
Q3'15
46%
Q3'15
87%
Q3'16
25%
Q3'16
44%
Q3'16
Wix.comView entire presentation