Bird Results Presentation Deck
Financial Highlights - FY'22
Revenue¹
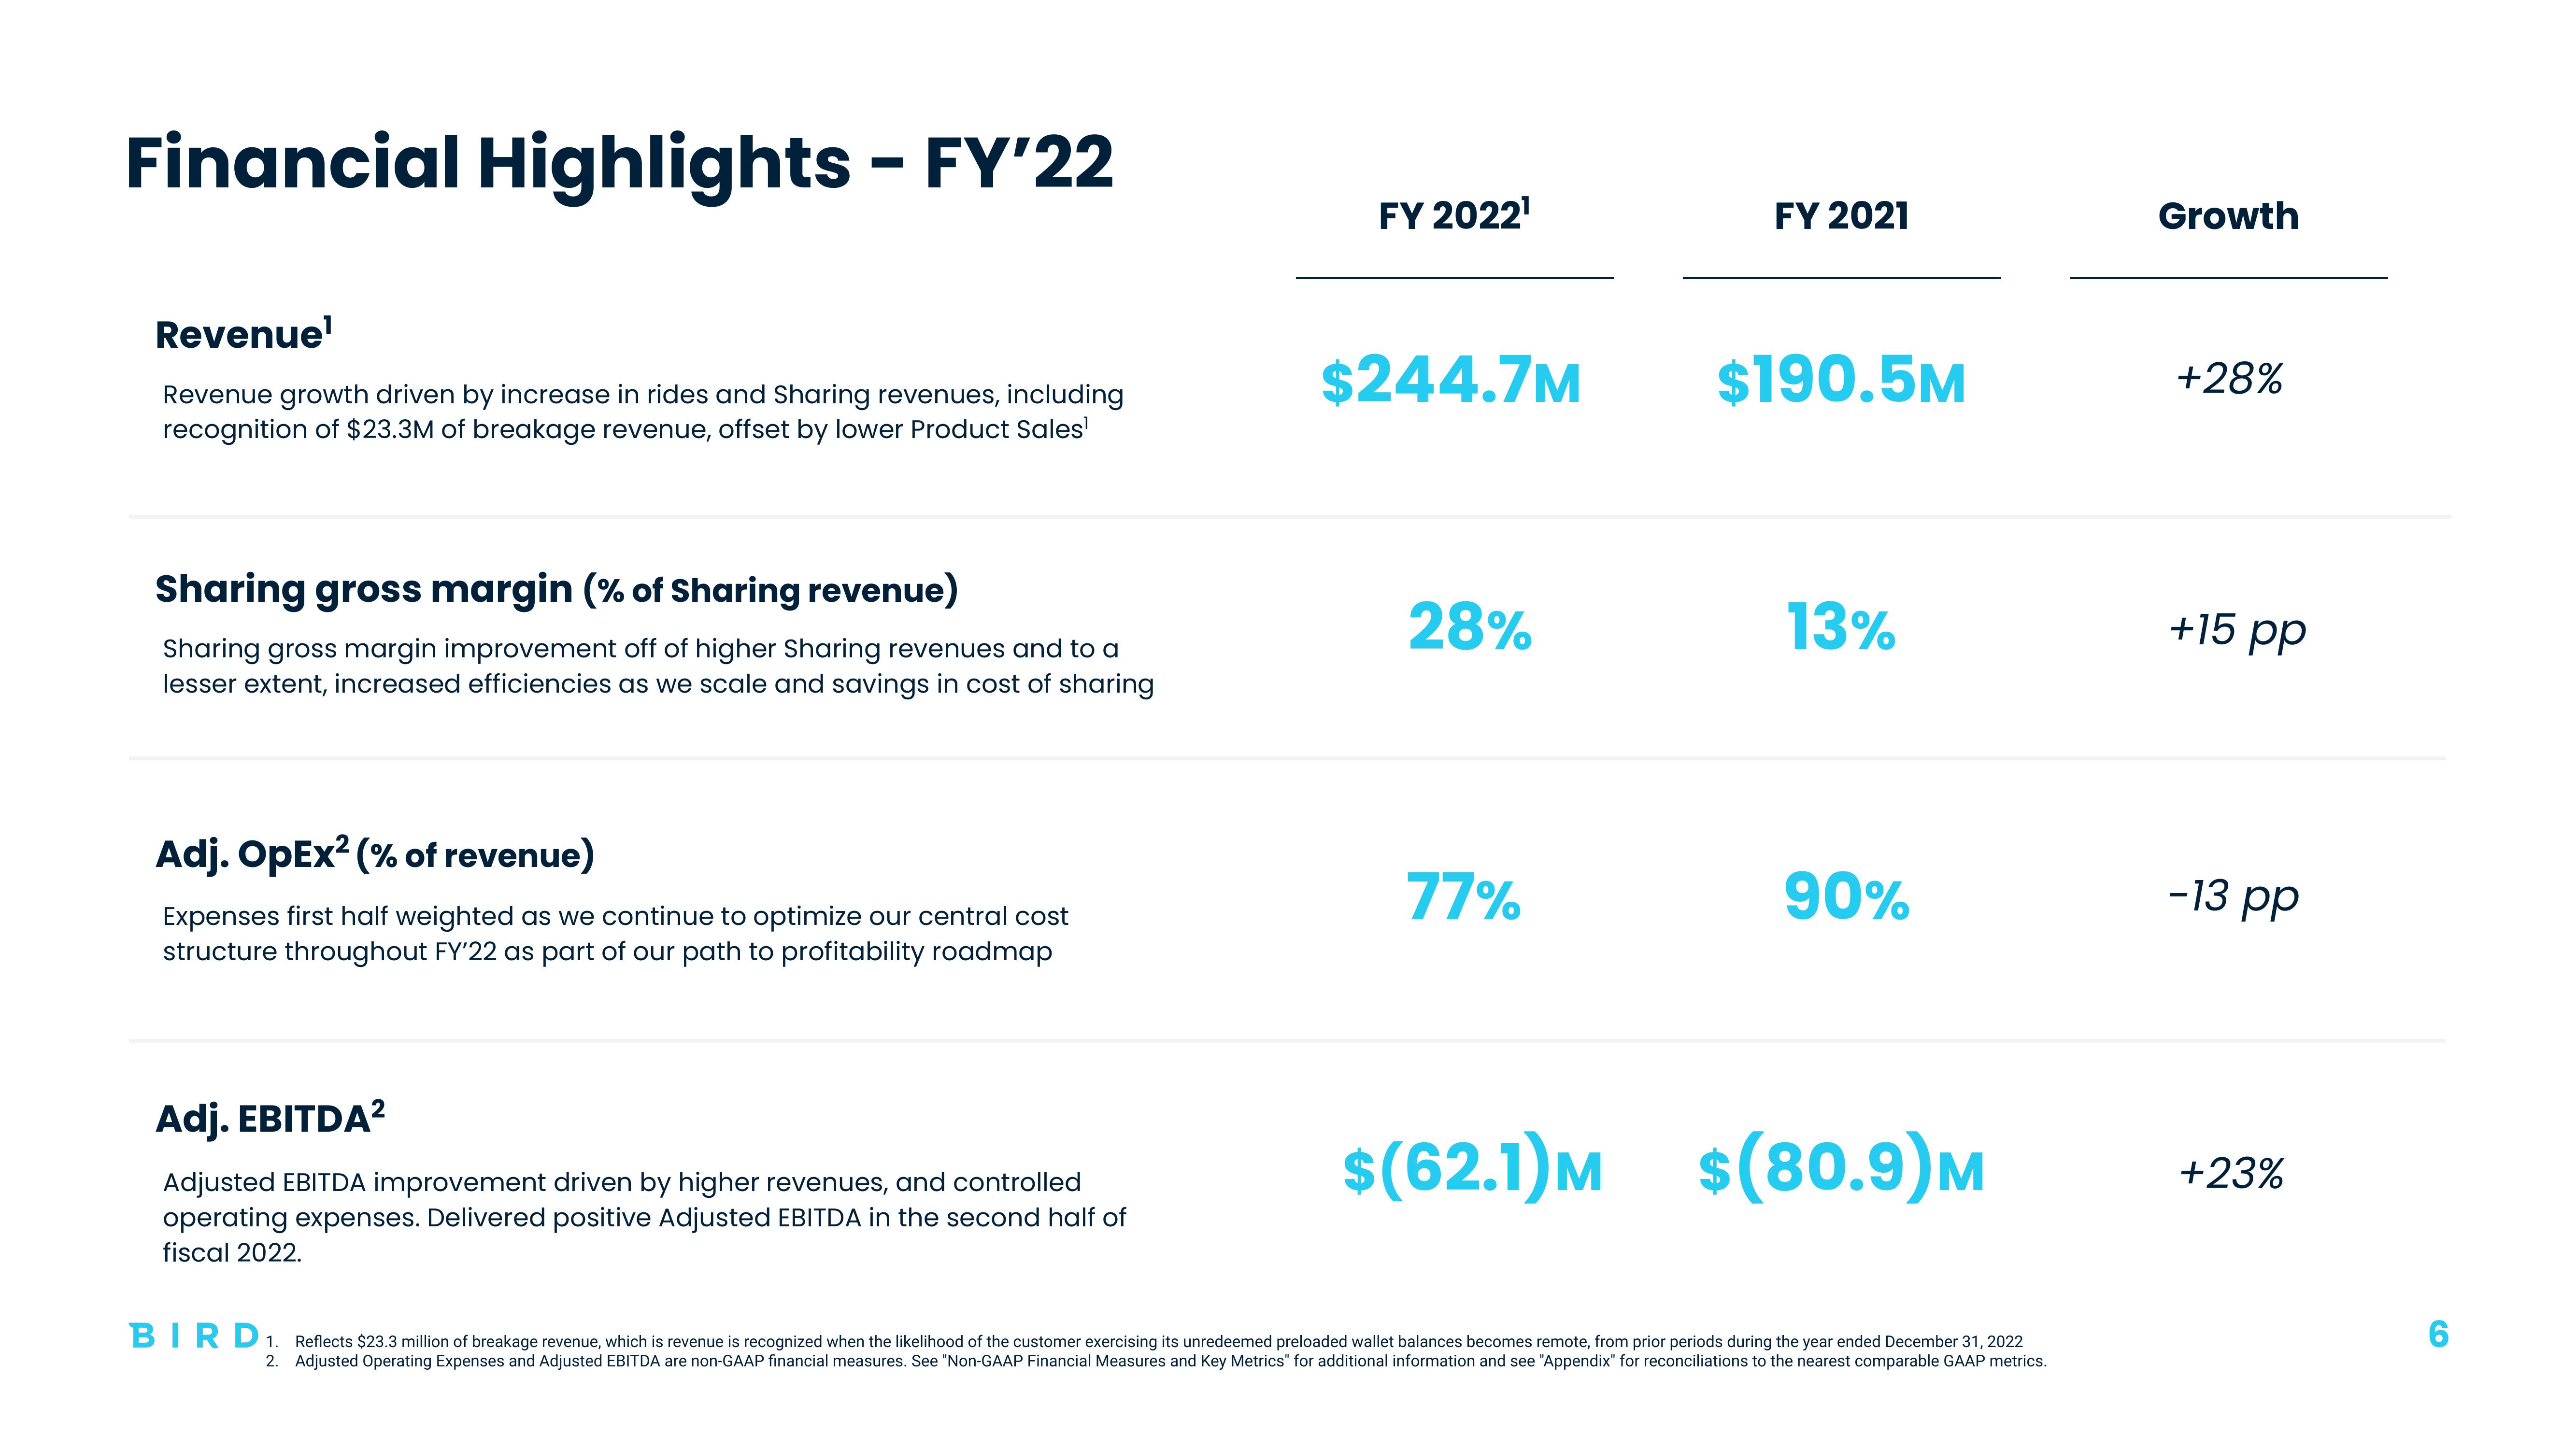
Revenue growth driven by increase in rides and Sharing revenues, including
recognition of $23.3M of breakage revenue, offset by lower Product Sales¹
Sharing gross margin (% of Sharing revenue)
Sharing gross margin improvement off of higher Sharing revenues and to a
lesser extent, increased efficiencies as we scale and savings in cost of sharing
Adj. OpEx² (% of revenue)
Expenses first half weighted as we continue to optimize our central cost
structure throughout FY'22 as part of our path to profitability roadmap
Adj. EBITDA²
Adjusted EBITDA improvement driven by higher revenues, and controlled
operating expenses. Delivered positive Adjusted EBITDA in the second half of
fiscal 2022.
FY 2022¹
$244.7M
28%
77%
FY 2021
$190.5M
13%
90%
$(62.1) M $(80.9)M
BIRD 1.
Reflects $23.3 million of breakage revenue, which is revenue is recognized when the likelihood of the customer exercising its unredeemed preloaded wallet balances becomes remote, from prior periods during the year ended December 31, 2022
2. Adjusted Operating Expenses and Adjusted EBITDA are non-GAAP financial measures. See "Non-GAAP Financial Measures and Key Metrics" for additional information and see "Appendix" for reconciliations to the nearest comparable GAAP metrics.
Growth
+28%
+15 pp
-13 pp
+23%
6View entire presentation