J.P.Morgan Investment Banking Pitch Book
VALUATION ANALYSIS
Overview of key financials
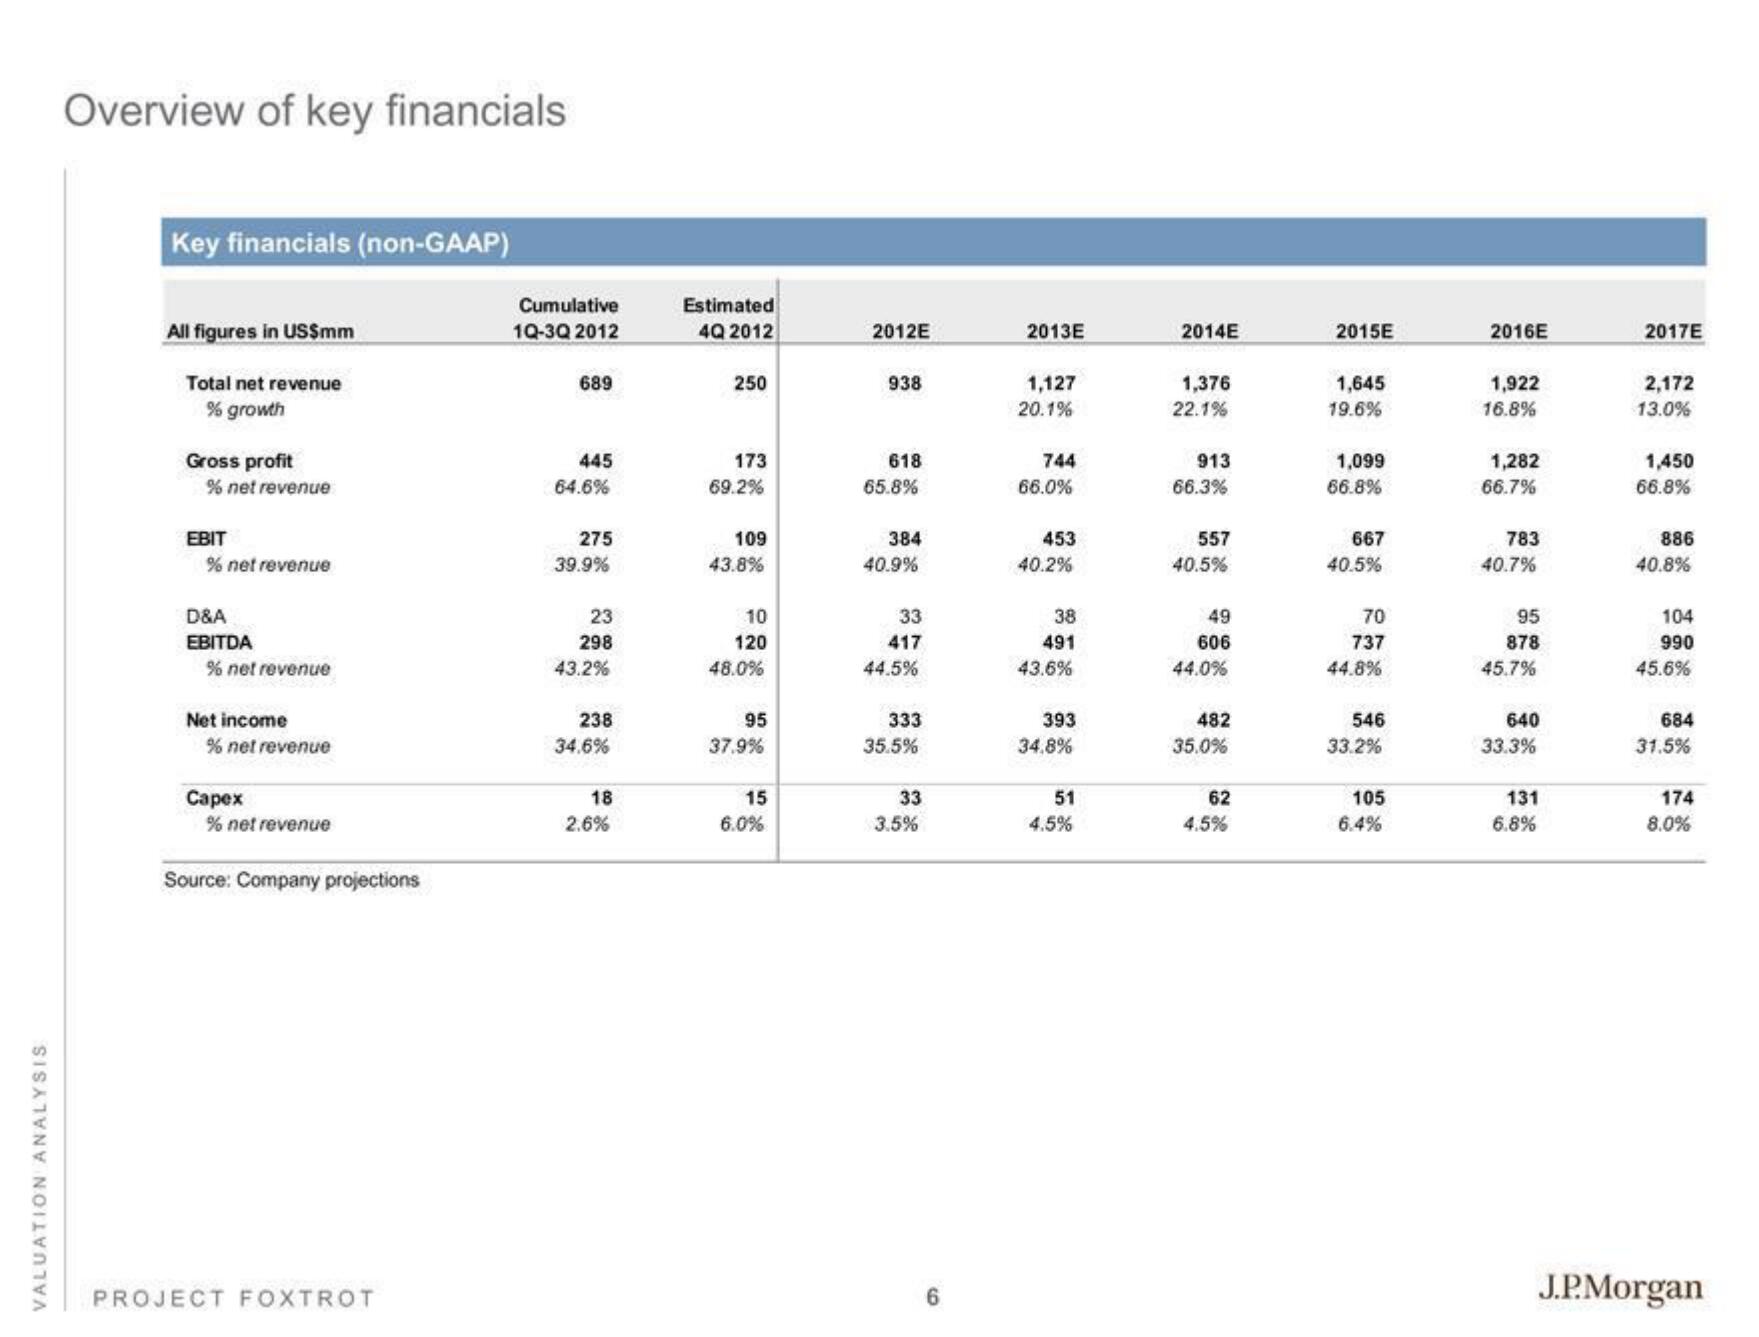
Key financials (non-GAAP)
All figures in US$mm
Total net revenue
% growth
Gross profit
% net revenue
EBIT
% net revenue
D&A
EBITDA
% net revenue
Net income
% net revenue
Capex
% net revenue
Source: Company projections
PROJECT FOXTROT
Cumulative
1Q-3Q 2012
689
445
64.6%
275
39.9%
23
298
43.2%
238
34.6%
18
2.6%
Estimated
4Q 2012
250
173
69.2%
109
43.8%
10
120
48.0%
95
37.9%
15
6.0%
2012E
938
618
65.8%
384
40.9%
33
417
44.5%
333
35.5%
33
3.5%
6
2013E
1,127
20.1%
744
66.0%
453
40.2%
38
491
43.6%
393
34.8%
51
4.5%
2014E
1,376
22.1%
913
66.3%
557
40.5%
49
606
44.0%
482
35.0%
62
4.5%
2015E
1,645
19.6%
1,099
66.8%
667
40.5%
70
737
44.8%
546
33.2%
105
6.4%
2016E
1,922
16.8%
1,282
66.7%
783
40.7%
95
878
45.7%
640
33.3%
131
6.8%
2017E
2,172
13.0%
1,450
66.8%
886
40.8%
104
990
45.6%
684
31.5%
174
8.0%
J.P.MorganView entire presentation