ads-tec Energy SPAC Presentation Deck
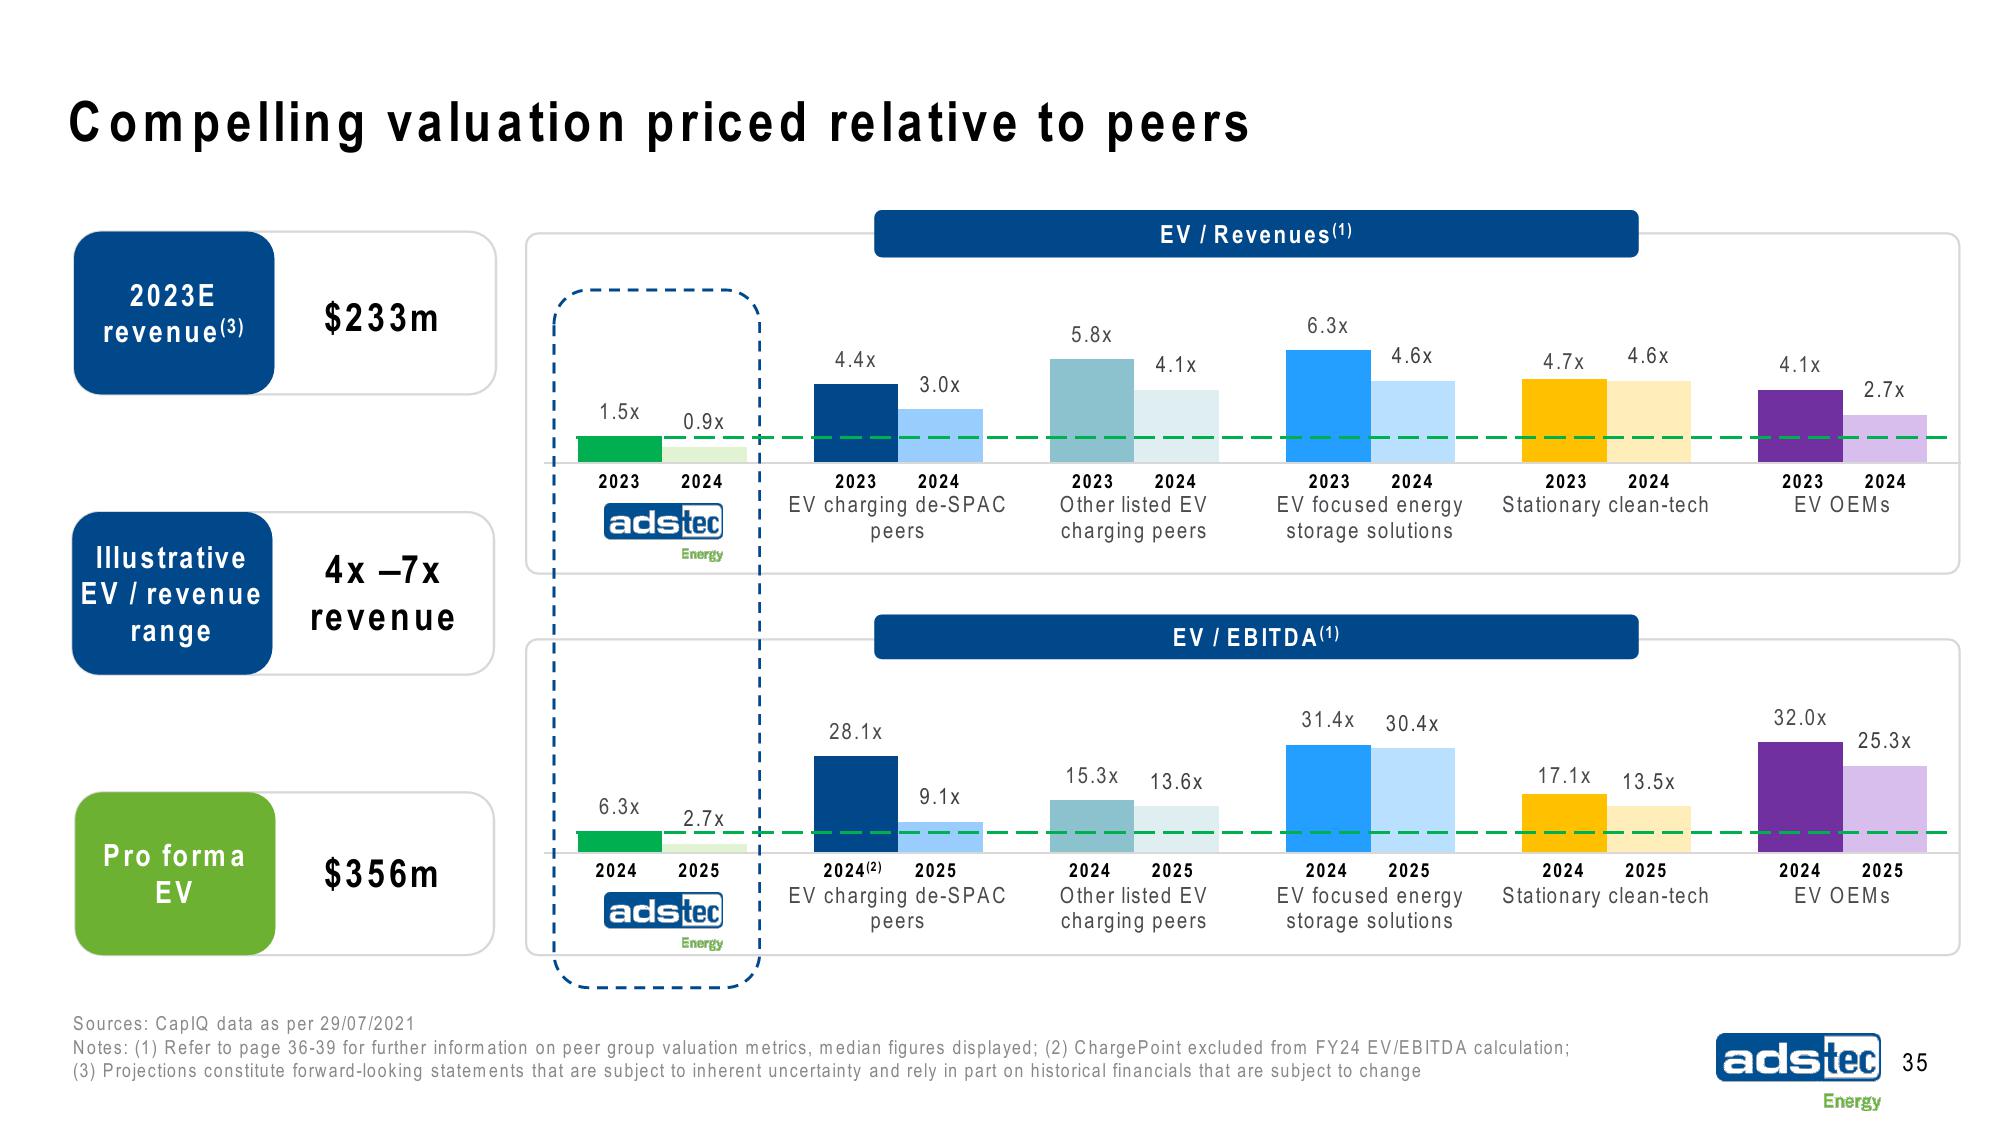
Compelling valuation priced relative to peers
2023E
revenue (³)
Illustrative
EV / revenue
range
Pro forma
EV
$233m
4x -7x
revenue
$356m
1.5x
2023
6.3x
0.9x
adstec
2024
2024
Energy
2.7x
2025
adstec
Energy
I
I
I
I
I
I
4.4x
3.0x
2023
2024
EV charging de-SPAC
peers
28.1x
9.1x
2024(2) 2025
EV charging de-SPAC
peers
5.8x
EV / Revenues (1)
15.3x
4.1x
2023 2024
Other listed EV
charging peers
13.6x
6.3x
EV / EBITDA (1)
2024 2025
Other listed EV
charging peers
2023 2024
EV focused energy
storage solutions
4.6x
31.4x
30.4x
2025
2024
EV focused energy
storage solutions
4.7x
2023
2024
Stationary clean-tech
17.1x
4.6x
Sources: CapIQ data as per 29/07/2021
Notes: (1) Refer to page 36-39 for further information on peer group valuation metrics, median figures displayed; (2) ChargePoint excluded from FY24 EV/EBITDA calculation;
(3) Projections constitute forward-looking statements that are subject to inherent uncertainty and rely in part on historical financials that are subject to change
13.5x
2024 2025
Stationary clean-tech
4.1x
2023 2024
EV OEMS
32.0x
2.7x
2024
25.3x
2025
EV OEMs
adstec 35
EnergyView entire presentation