HBT Financial Results Presentation Deck
Loan Portfolio Overview: Commercial and Commercial Real Estate
Commercial Loan Portfolio
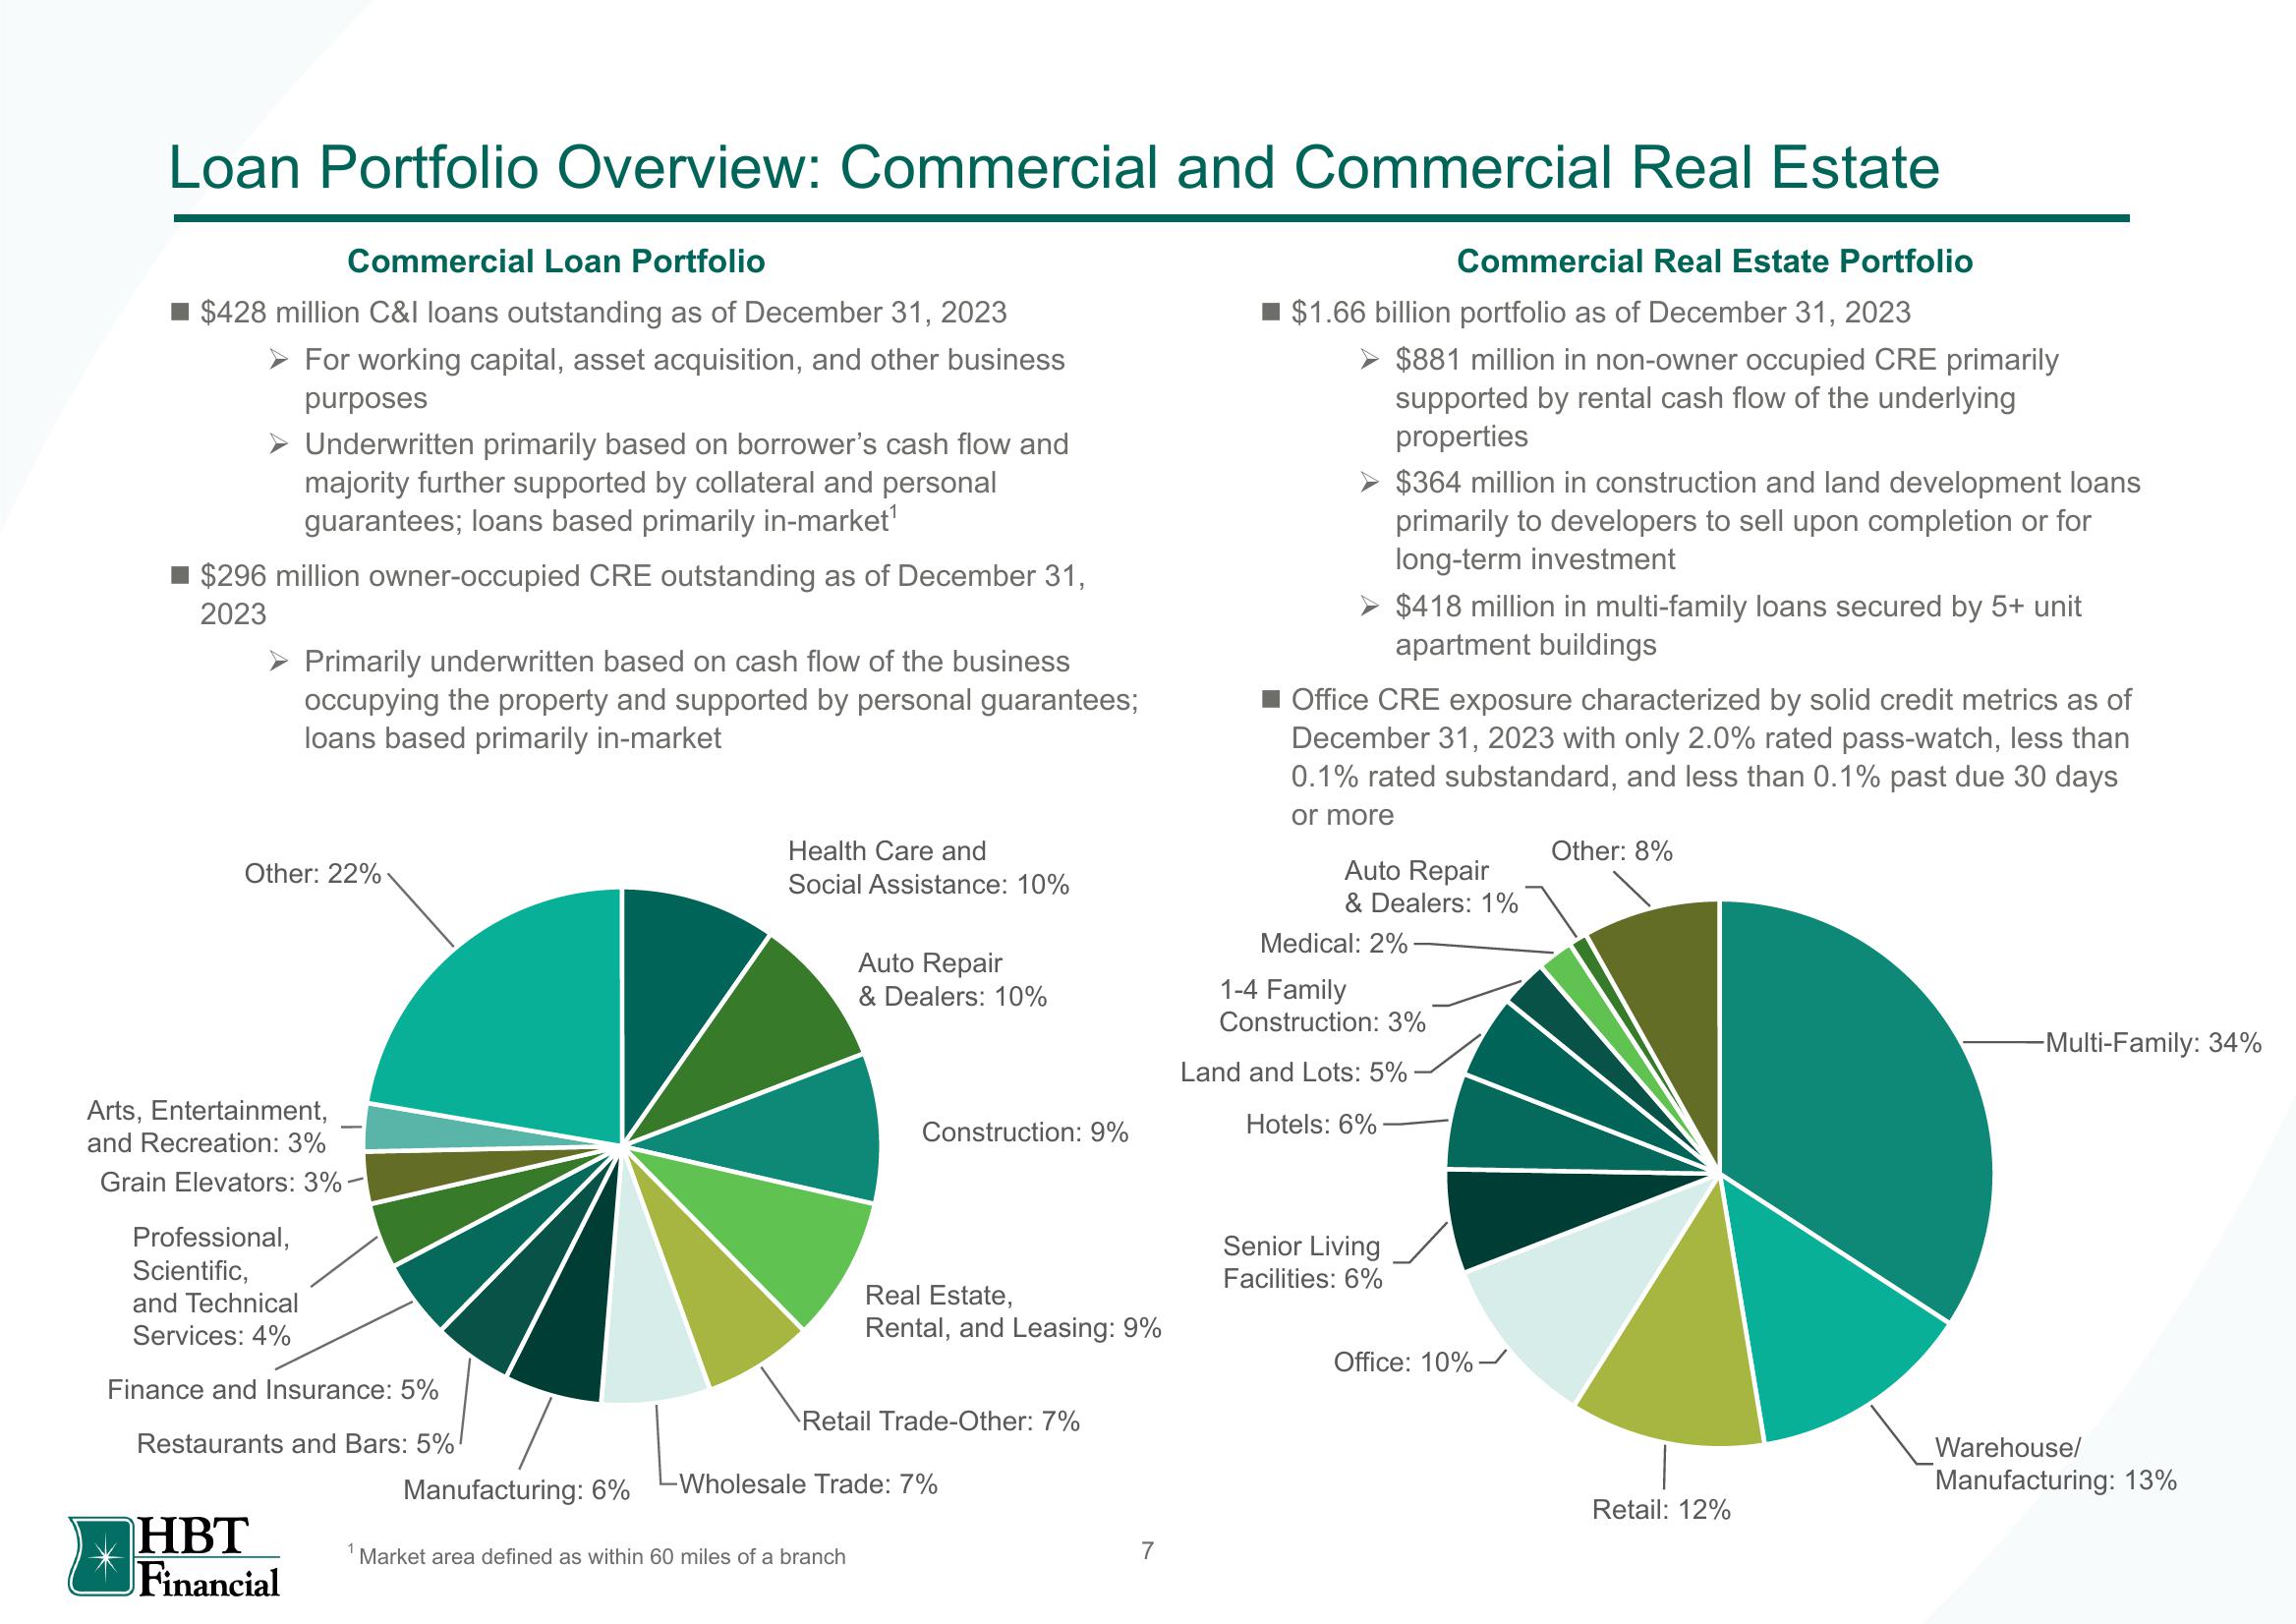
$428 million C&I loans outstanding as of December 31, 2023
➤ For working capital, asset acquisition, and other business
purposes
> Underwritten primarily based on borrower's cash flow and
majority further supported by collateral and personal
guarantees; loans based primarily in-market¹
$296 million owner-occupied CRE outstanding as of December 31,
2023
➤ Primarily underwritten based on cash flow of the business
occupying the property and supported by personal guarantees;
loans based primarily in-market
Other: 22%
Arts, Entertainment,
and Recreation: 3%
Grain Elevators: 3%-
Professional,
Scientific,
and Technical
Services: 4%
Finance and Insurance: 5%
Restaurants and Bars: 5%
HBT
Financial
1
Manufacturing: 6%
Health Care and
Social Assistance: 10%
Auto Repair
& Dealers: 10%
Construction: 9%
Market area defined as within 60 miles of a branch
Real Estate,
Rental, and Leasing: 9%
Retail Trade-Other: 7%
Wholesale Trade: 7%
7
Commercial Real Estate Portfolio
$1.66 billion portfolio as of December 31, 2023
$881 million in non-owner occupied CRE primarily
supported by rental cash flow of the underlying
properties
➤ $364 million in construction and land development loans
primarily to developers to sell upon completion or for
long-term investment
> $418 million in multi-family loans secured by 5+ unit
apartment buildings
Office CRE exposure characterized by solid credit metrics as of
December 31, 2023 with only 2.0% rated pass-watch, less than
0.1% rated substandard, and less than 0.1% past due 30 days
or more
Auto Repair
& Dealers: 1%
Medical: 2%-
1-4 Family
Construction: 3%
Land and Lots: 5%
Hotels: 6%
Senior Living
Facilities: 6%
Office: 10%-
Other: 8%
Retail: 12%
-Multi-Family: 34%
Warehouse/
Manufacturing: 13%View entire presentation