Antero Midstream Partners Investor Presentation Deck
Antero Midstream Non-GAAP Reconciliation
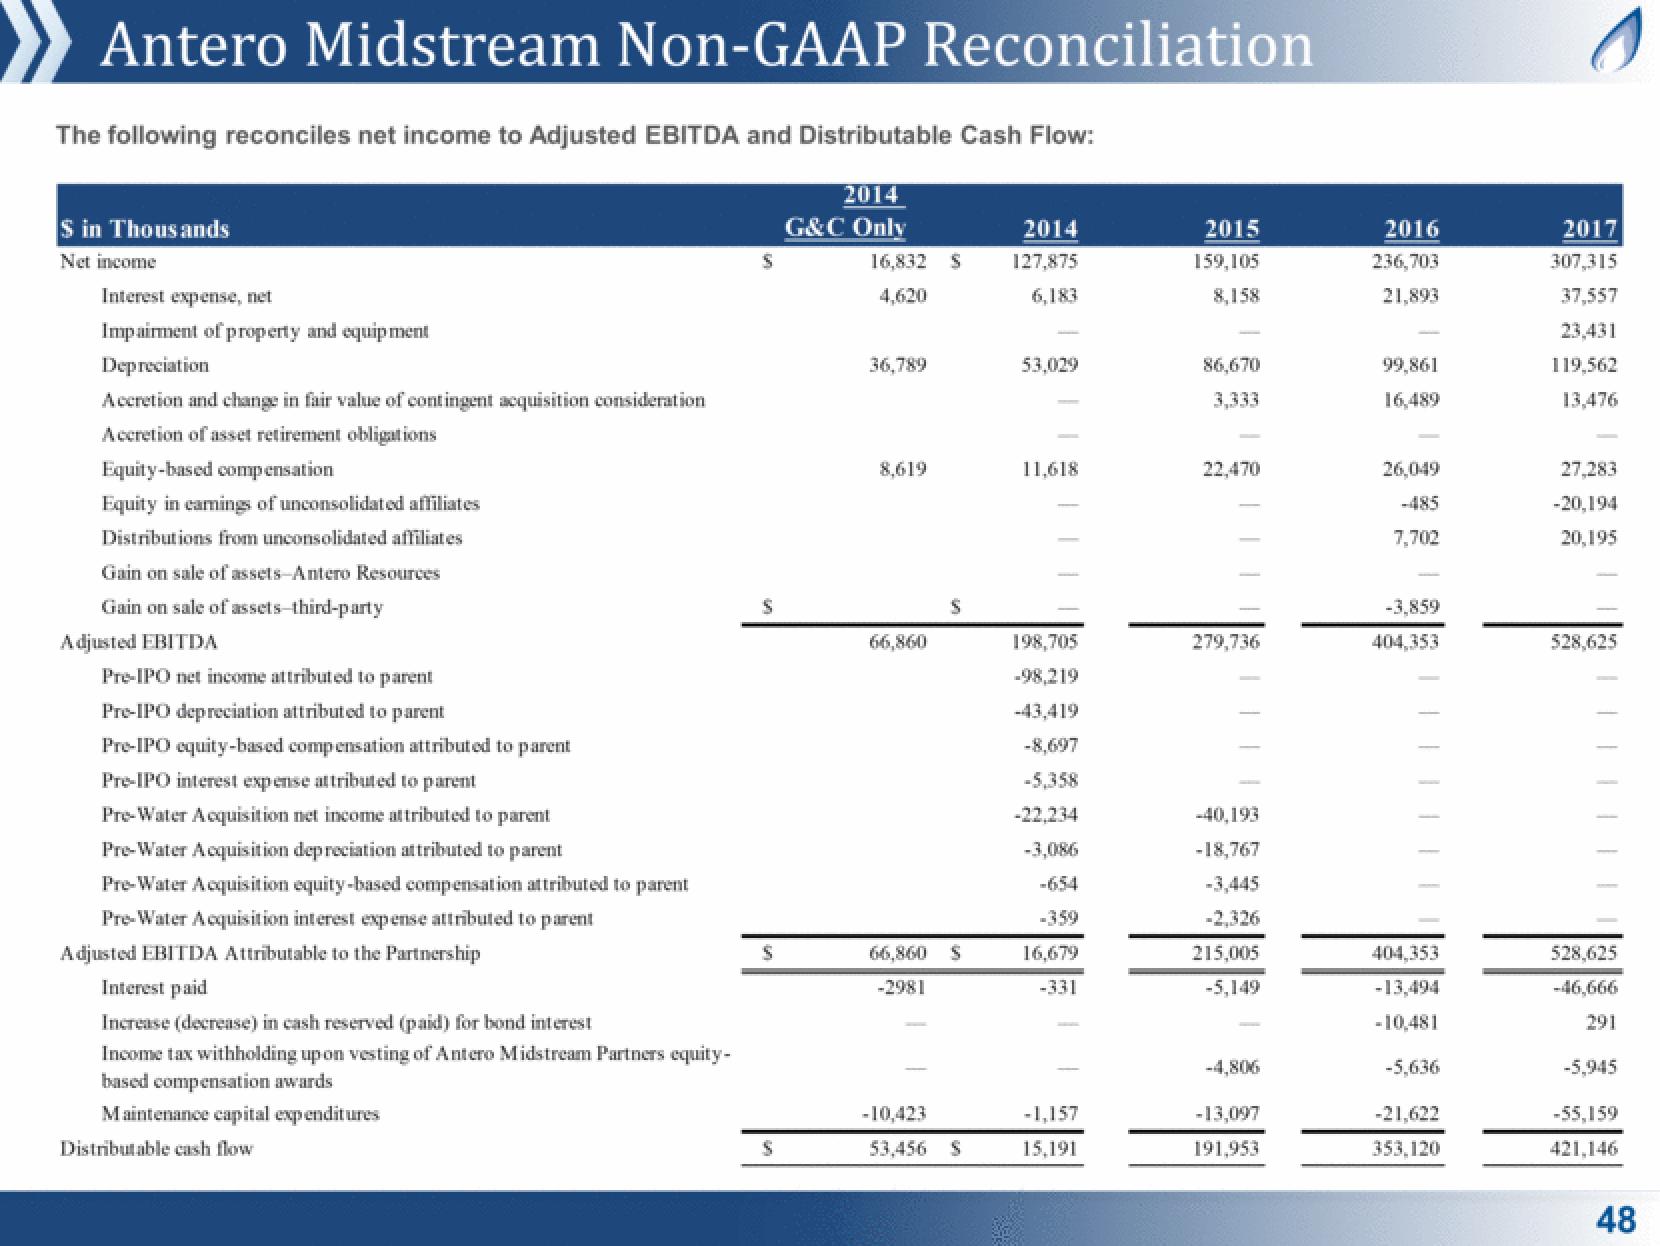
The following reconciles net income to Adjusted EBITDA and Distributable Cash Flow:
2014
G&C Only
S in Thousands
Net income
Interest expense, net
Impairment of property and equipment
Depreciation
Accretion and change in fair value of contingent acquisition consideration
Accretion of asset retirement obligations
Equity-based compensation
Equity in earnings of unconsolidated affiliates
Distributions from unconsolidated affiliates
Gain on sale of assets-Antero Resources
Gain on sale of assets-third-party
Adjusted EBITDA
Pre-IPO net income attributed to parent
Pre-IPO depreciation attributed to parent
Pre-IPO equity-based compensation attributed to parent
Pre-IPO interest expense attributed to parent
Pre-Water Acquisition net income attributed to parent
Pre-Water Acquisition depreciation attributed to parent
Pre-Water Acquisition equity-based compensation attributed to parent
Pre-Water Acquisition interest expense attributed to parent
Adjusted EBITDA Attributable to the Partnership
Interest paid
Increase (decrease) in cash reserved (paid) for bond interest
Income tax withholding upon vesting of Antero Midstream Partners equity-
based compensation awards
Maintenance capital expenditures
Distributable cash flow
S
S
S
S
16,832 S
4,620
36,789
8,619
66,860
66,860
-2981
-10,423
53,456
S
S
2014
127,875
6,183
53,029
11,618
198,705
-98,219
-43,419
-8,697
-5,358
-22,234
-3,086
16,679
-331
-1,157
15,191
2015
159,105
8,158
86,670
22,470
279,736
-40,193
-18,767
-3,445
215,005
-5,149
-4,806
-13,097
191,953
2016
236,703
21,893
99,861
16,489
26,049
7,702
-
-3,859
404,353
404,353
-13,494
-10,481
-5,636
-21,622
353,120
s
2017
307,315
37,557
23,431
119,562
13,476
27,283
-20,194
20,195
528,625
528,625
-46,666
291
-5,945
-55,159
421,146
48View entire presentation