Bank of America Investment Banking Pitch Book
I
Pioneer Forecast
Pioneer Aug-13
Management Case
Wall Street
Consensus
Pioneer 2013 Sale
Process Case
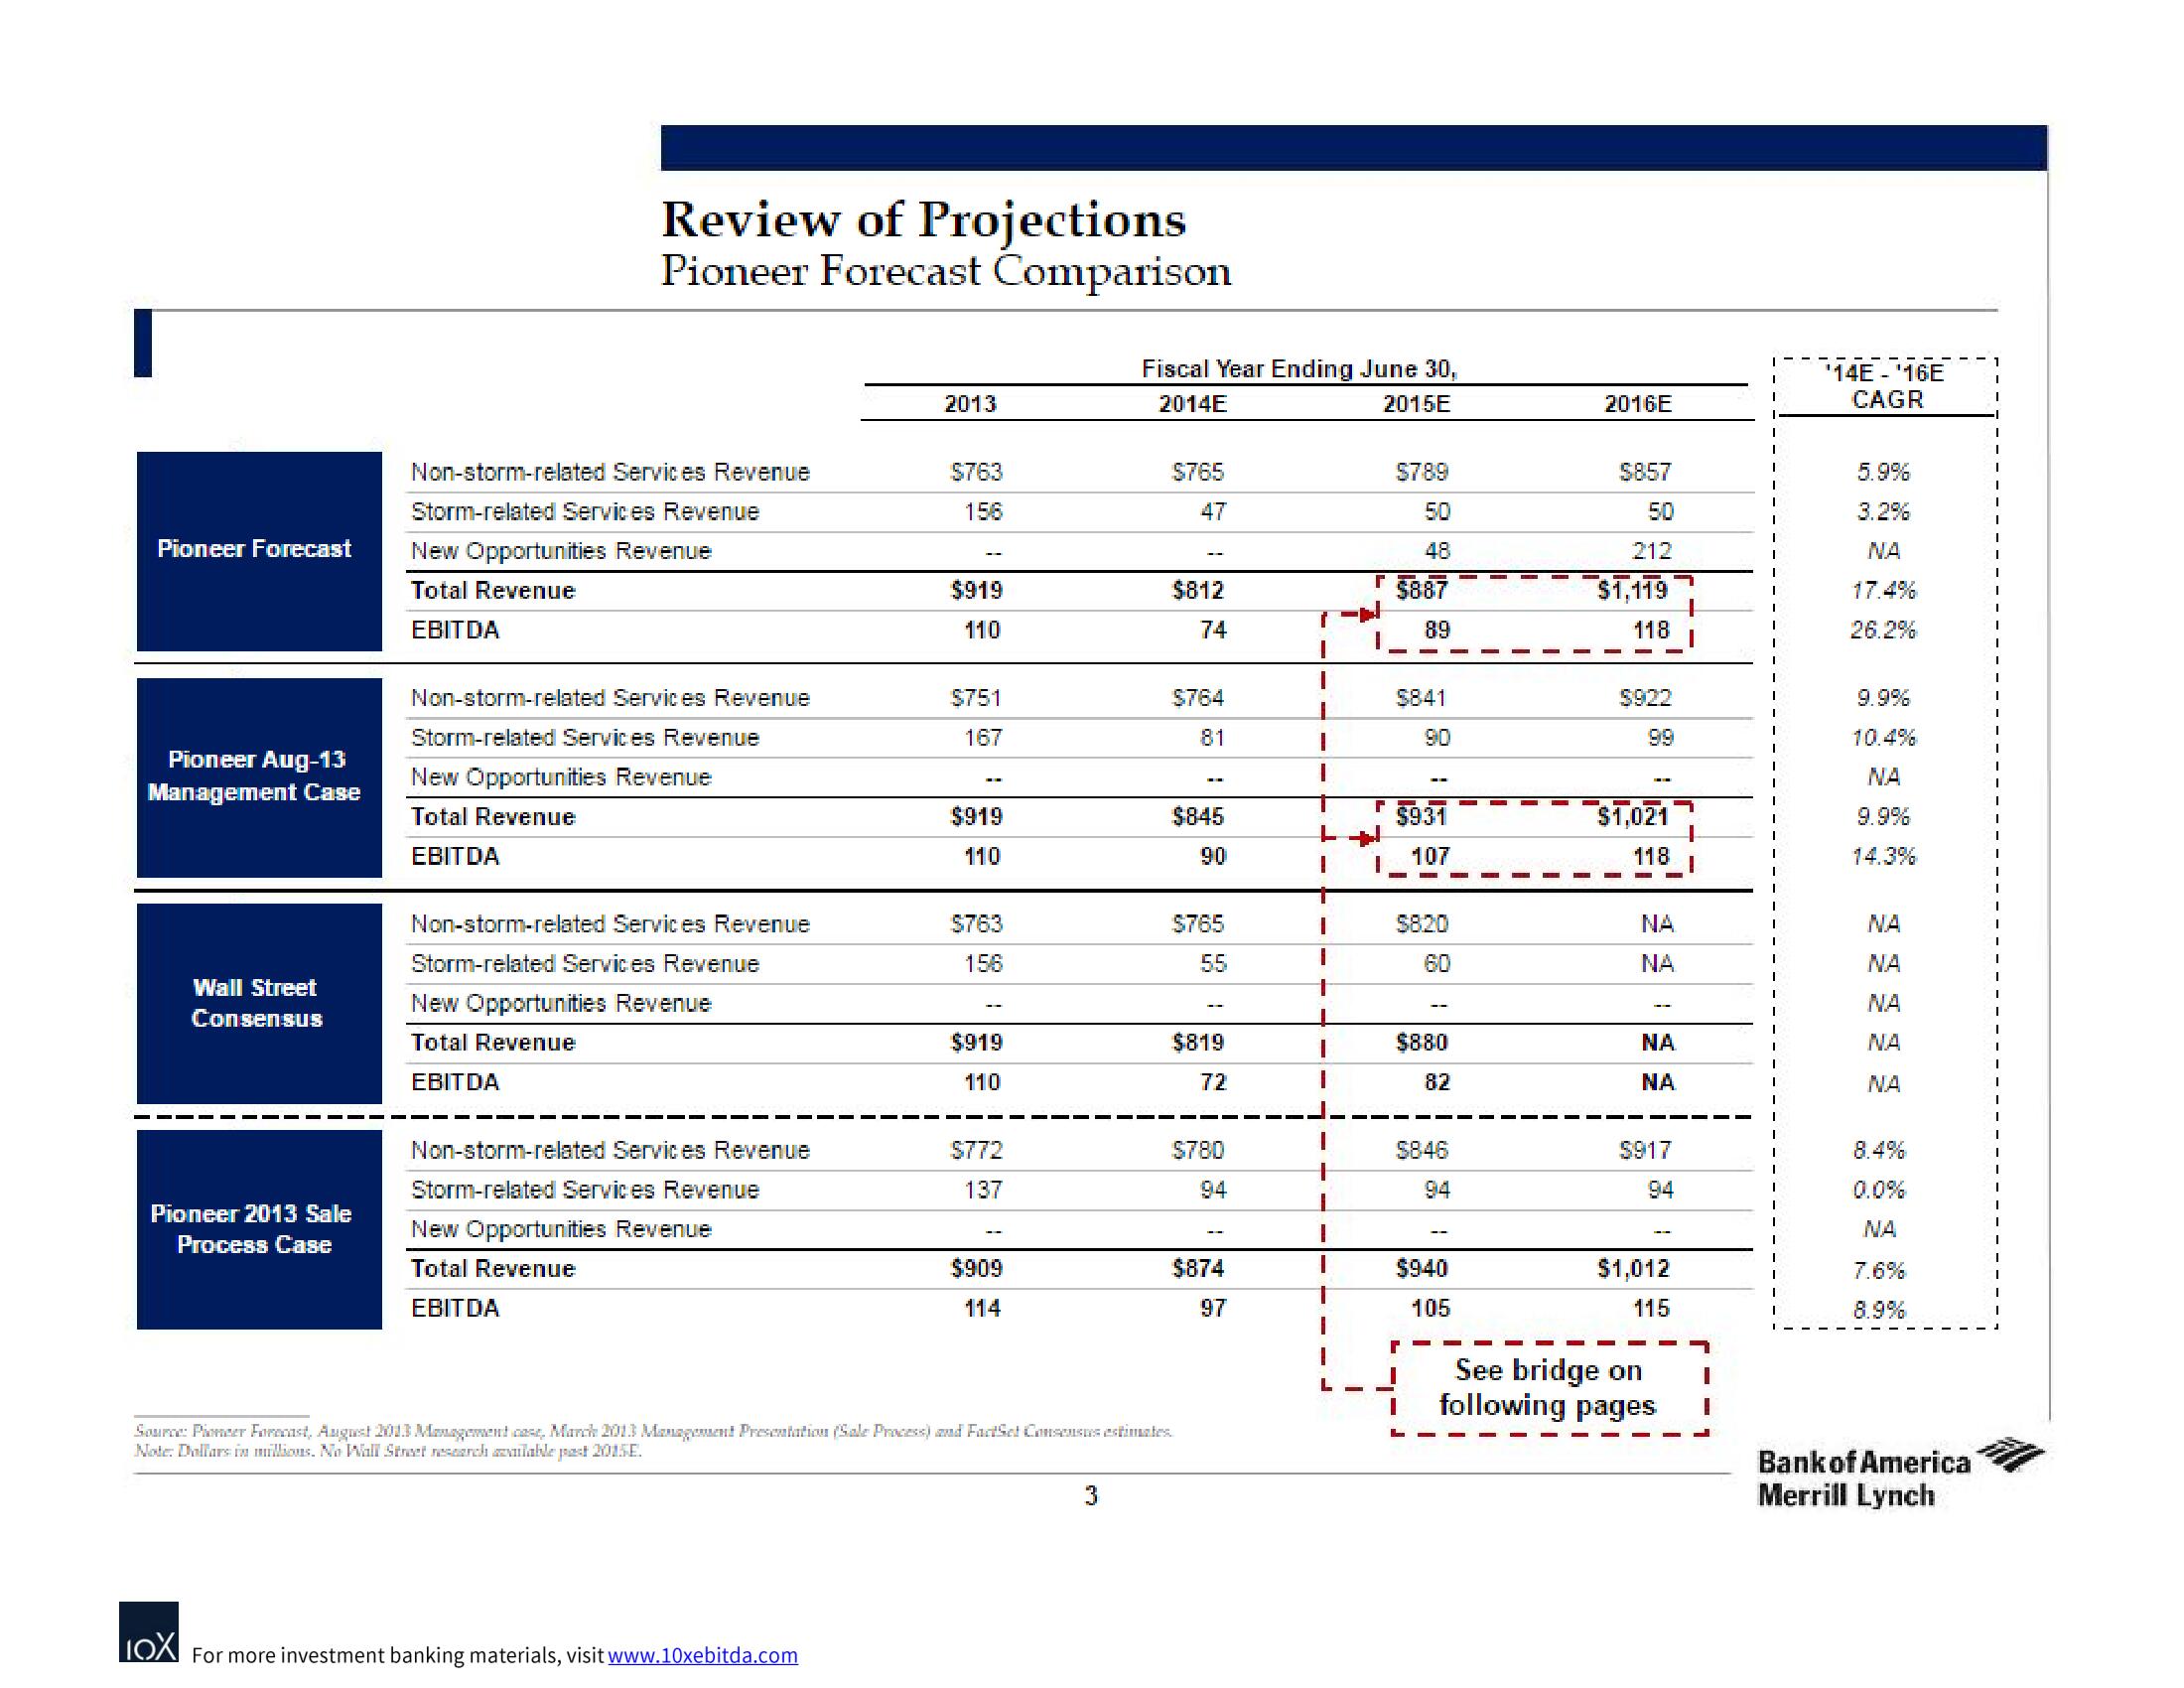
Review of Projections
Pioneer Forecast Comparison
Non-storm-related Services Revenue
Storm-related Services Revenue
New Opportunities Revenue
Total Revenue
EBITDA
Non-storm-related Services Revenue
Storm-related Services Revenue
New Opportunities Revenue
Total Revenue
EBITDA
Non-storm-related Services Revenue
Storm-related Services Revenue
New Opportunities Revenue
Total Revenue
EBITDA
Non-storm-related Services Revenue
Storm-related Services Revenue
New Opportunities Revenue
Total Revenue
EBITDA
2013
LOX For more investment banking materials, visit www.10xebitda.com
$763
156
$919
110
$751
167
$919
110
$763
156
$919
110
$772
137
$909
114
Fiscal Year Ending June 30,
2014E
2015E
3
$765
47
$812
74
$764
81
$845
90
$765
55
$819
72
$780
Source: Pioneer Forecast, August 2013 Management case, March 2013 Management Presentation (Sale Process) and FactSet Consensus estimates.
Note: Dollars in millions. No Wall Street research vilable pest 2015E.
$874
97
T
1
I
I
T
L
I
L
$789
50
48
T 5887
N
89
5841
90
$931
I 107
$8.20
60
$880
82
$846
94
$940
105
I
2016E
$857
50
212
$1,119
118
5922
99
$1,021
118
NA
NA
NA
NA
$917
94
$1,012
115
See bridge on
following pages
I
I
I
I
T
1
I
I
I
T
I
I
I
I
T
I
I
I
I
I
'14E - '16E
CAGR
5.9%
3.2%
NA
17.4%
26.2%
9.9%
10.4%
NA
9.9%
14.3%
NA
NA
NA
NA
NA
0.0%
NA
7.6%
8.9%
Bank of America
Merrill Lynch
1
I
I
IView entire presentation