Uber Results Presentation Deck
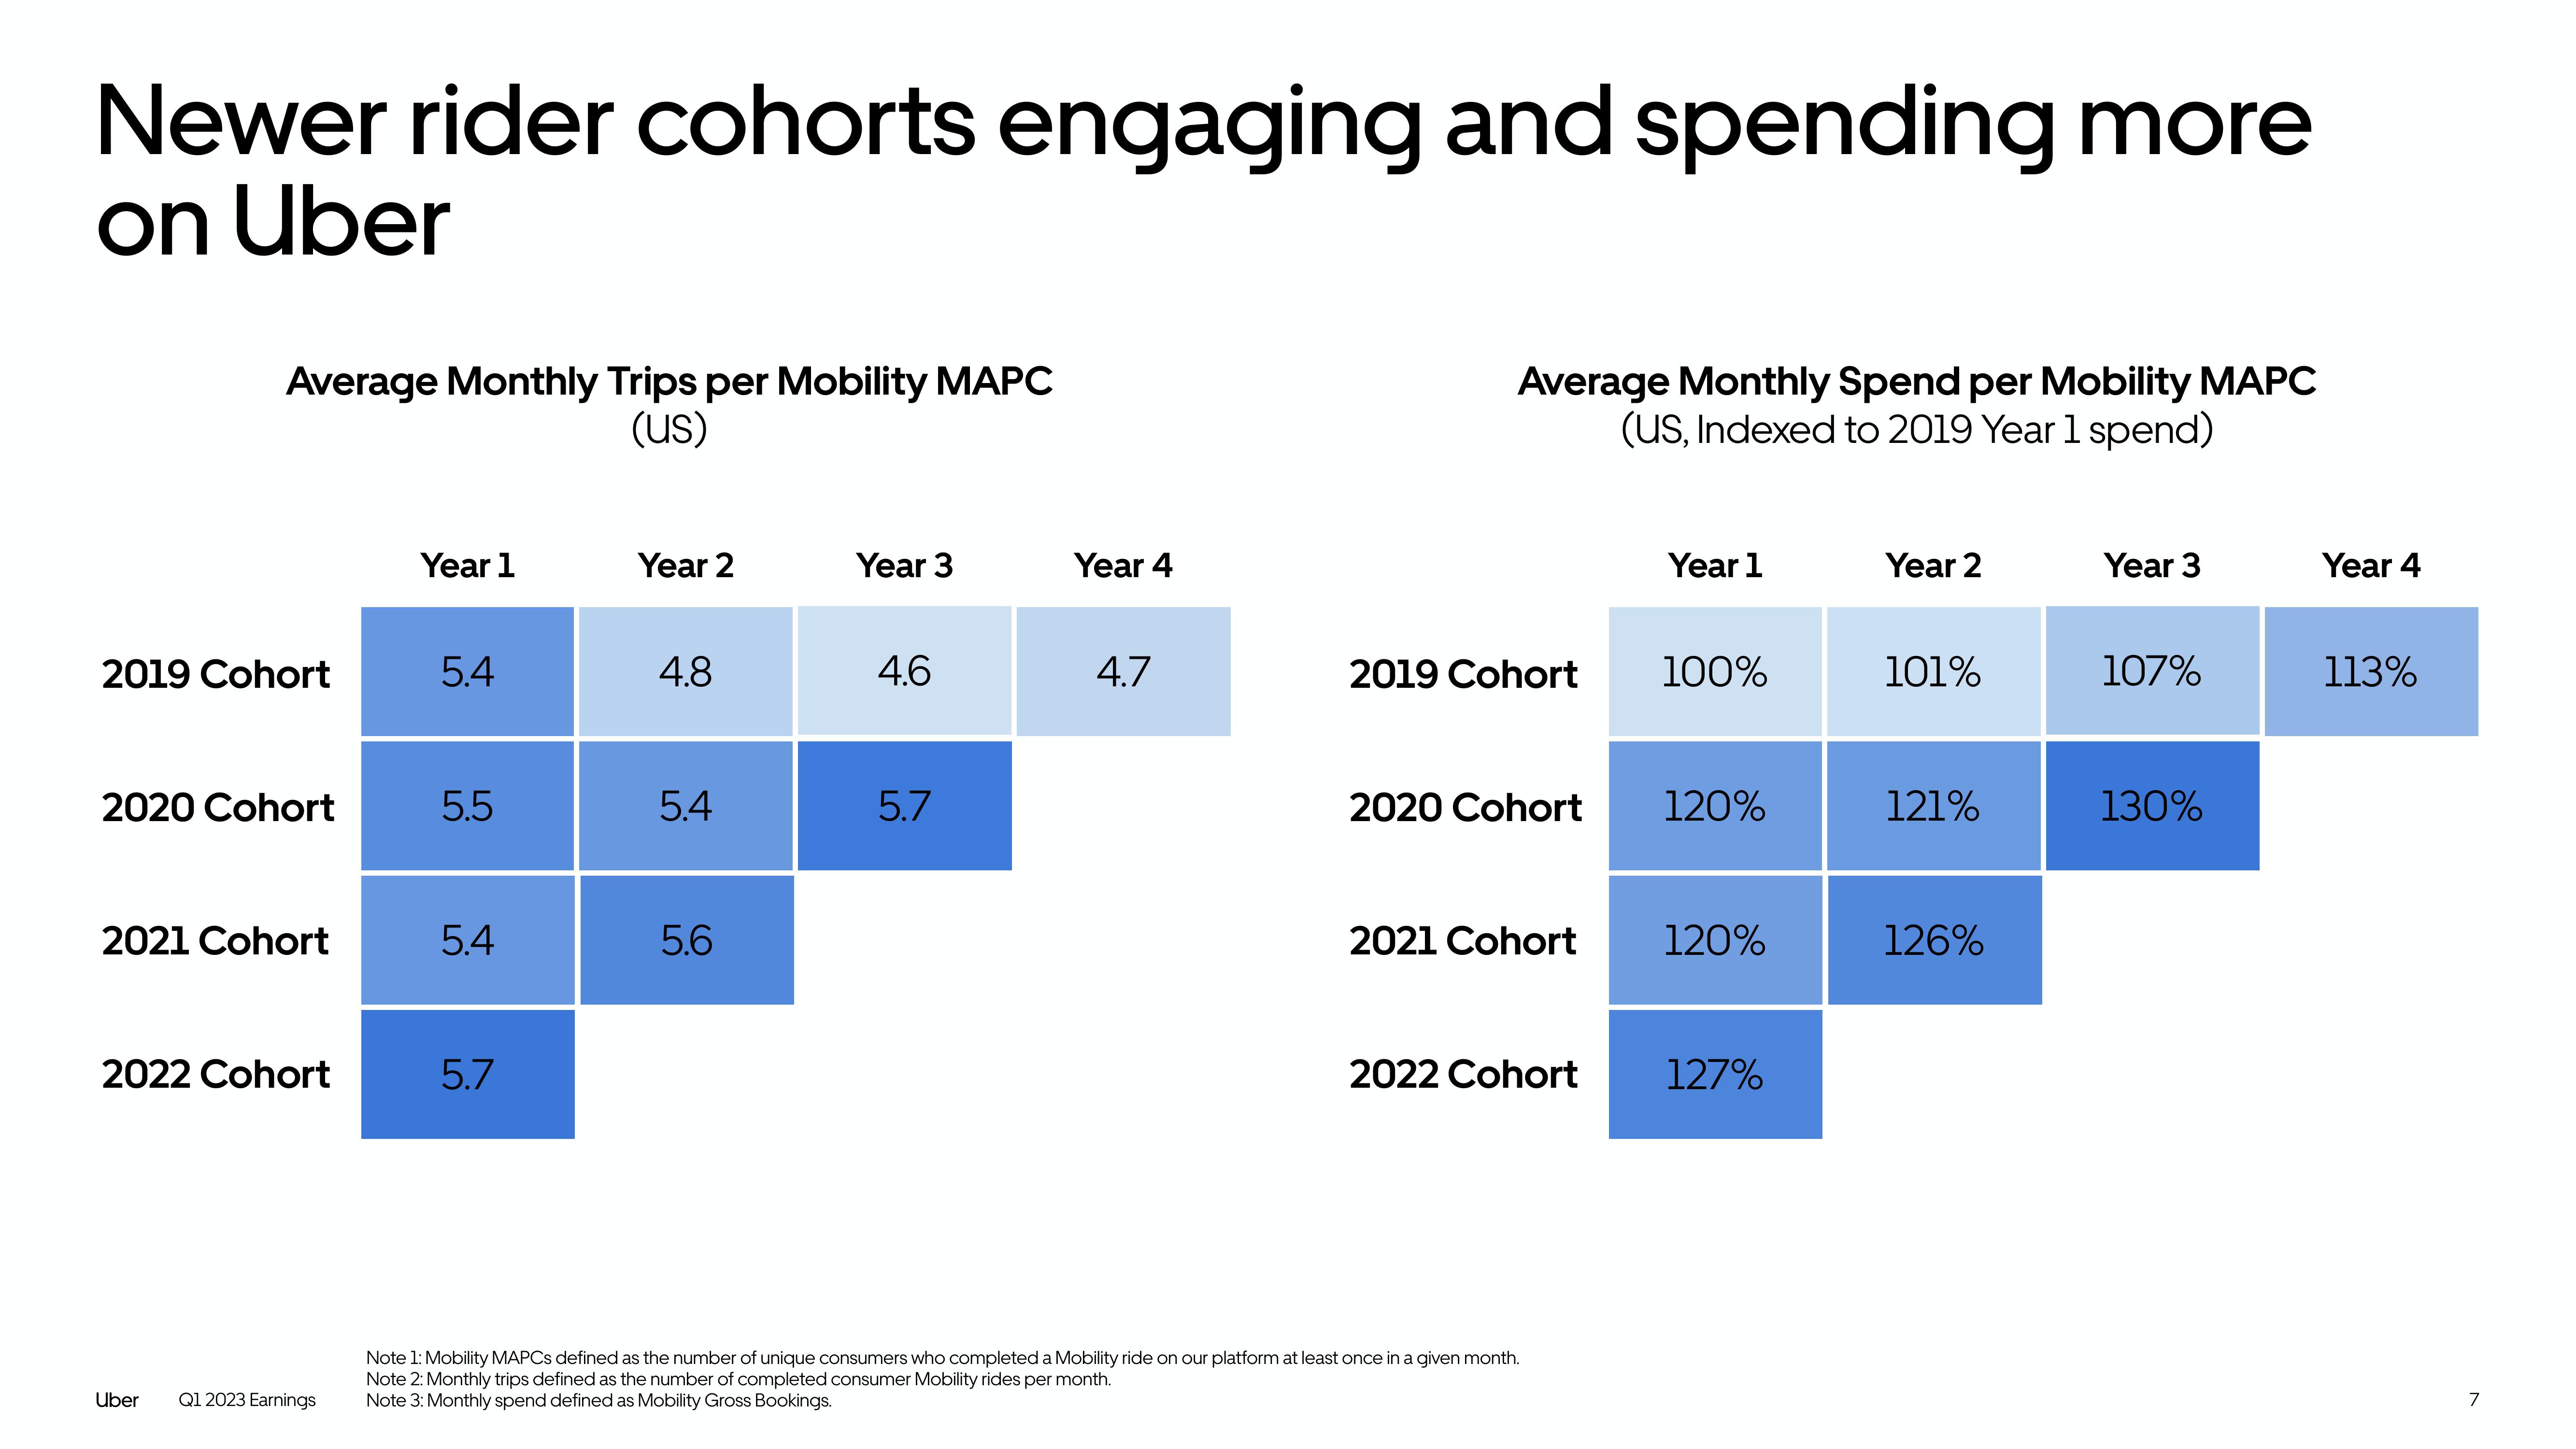
Newer rider cohorts engaging and spending more
on Uber
Average Monthly Trips per Mobility MAPC
(us)
2019 Cohort
2020 Cohort
2021 Cohort
2022 Cohort
Uber
Q1 2023 Earnings
Year 1
5.4
5.5
5.4
5.7
Year 2
4.8
5.4
5.6
Year 3
4.6
5.7
Year 4
4.7
Average Monthly Spend per Mobility MAPC
(US, Indexed to 2019 Year 1 spend)
2019 Cohort 100%
2020 Cohort
2021 Cohort
2022 Cohort
Year 1
Note 1: Mobility MAPCS defined as the number of unique consumers who completed a Mobility ride on our platform at least once in a given month.
Note 2: Monthly trips defined as the number of completed consumer Mobility rides per month.
Note 3: Monthly spend defined as Mobility Gross Bookings.
120%
120%
127%
Year 2
101%
121%
126%
Year 3
107%
130%
Year 4
113%
7View entire presentation