Energy Vault SPAC Presentation Deck
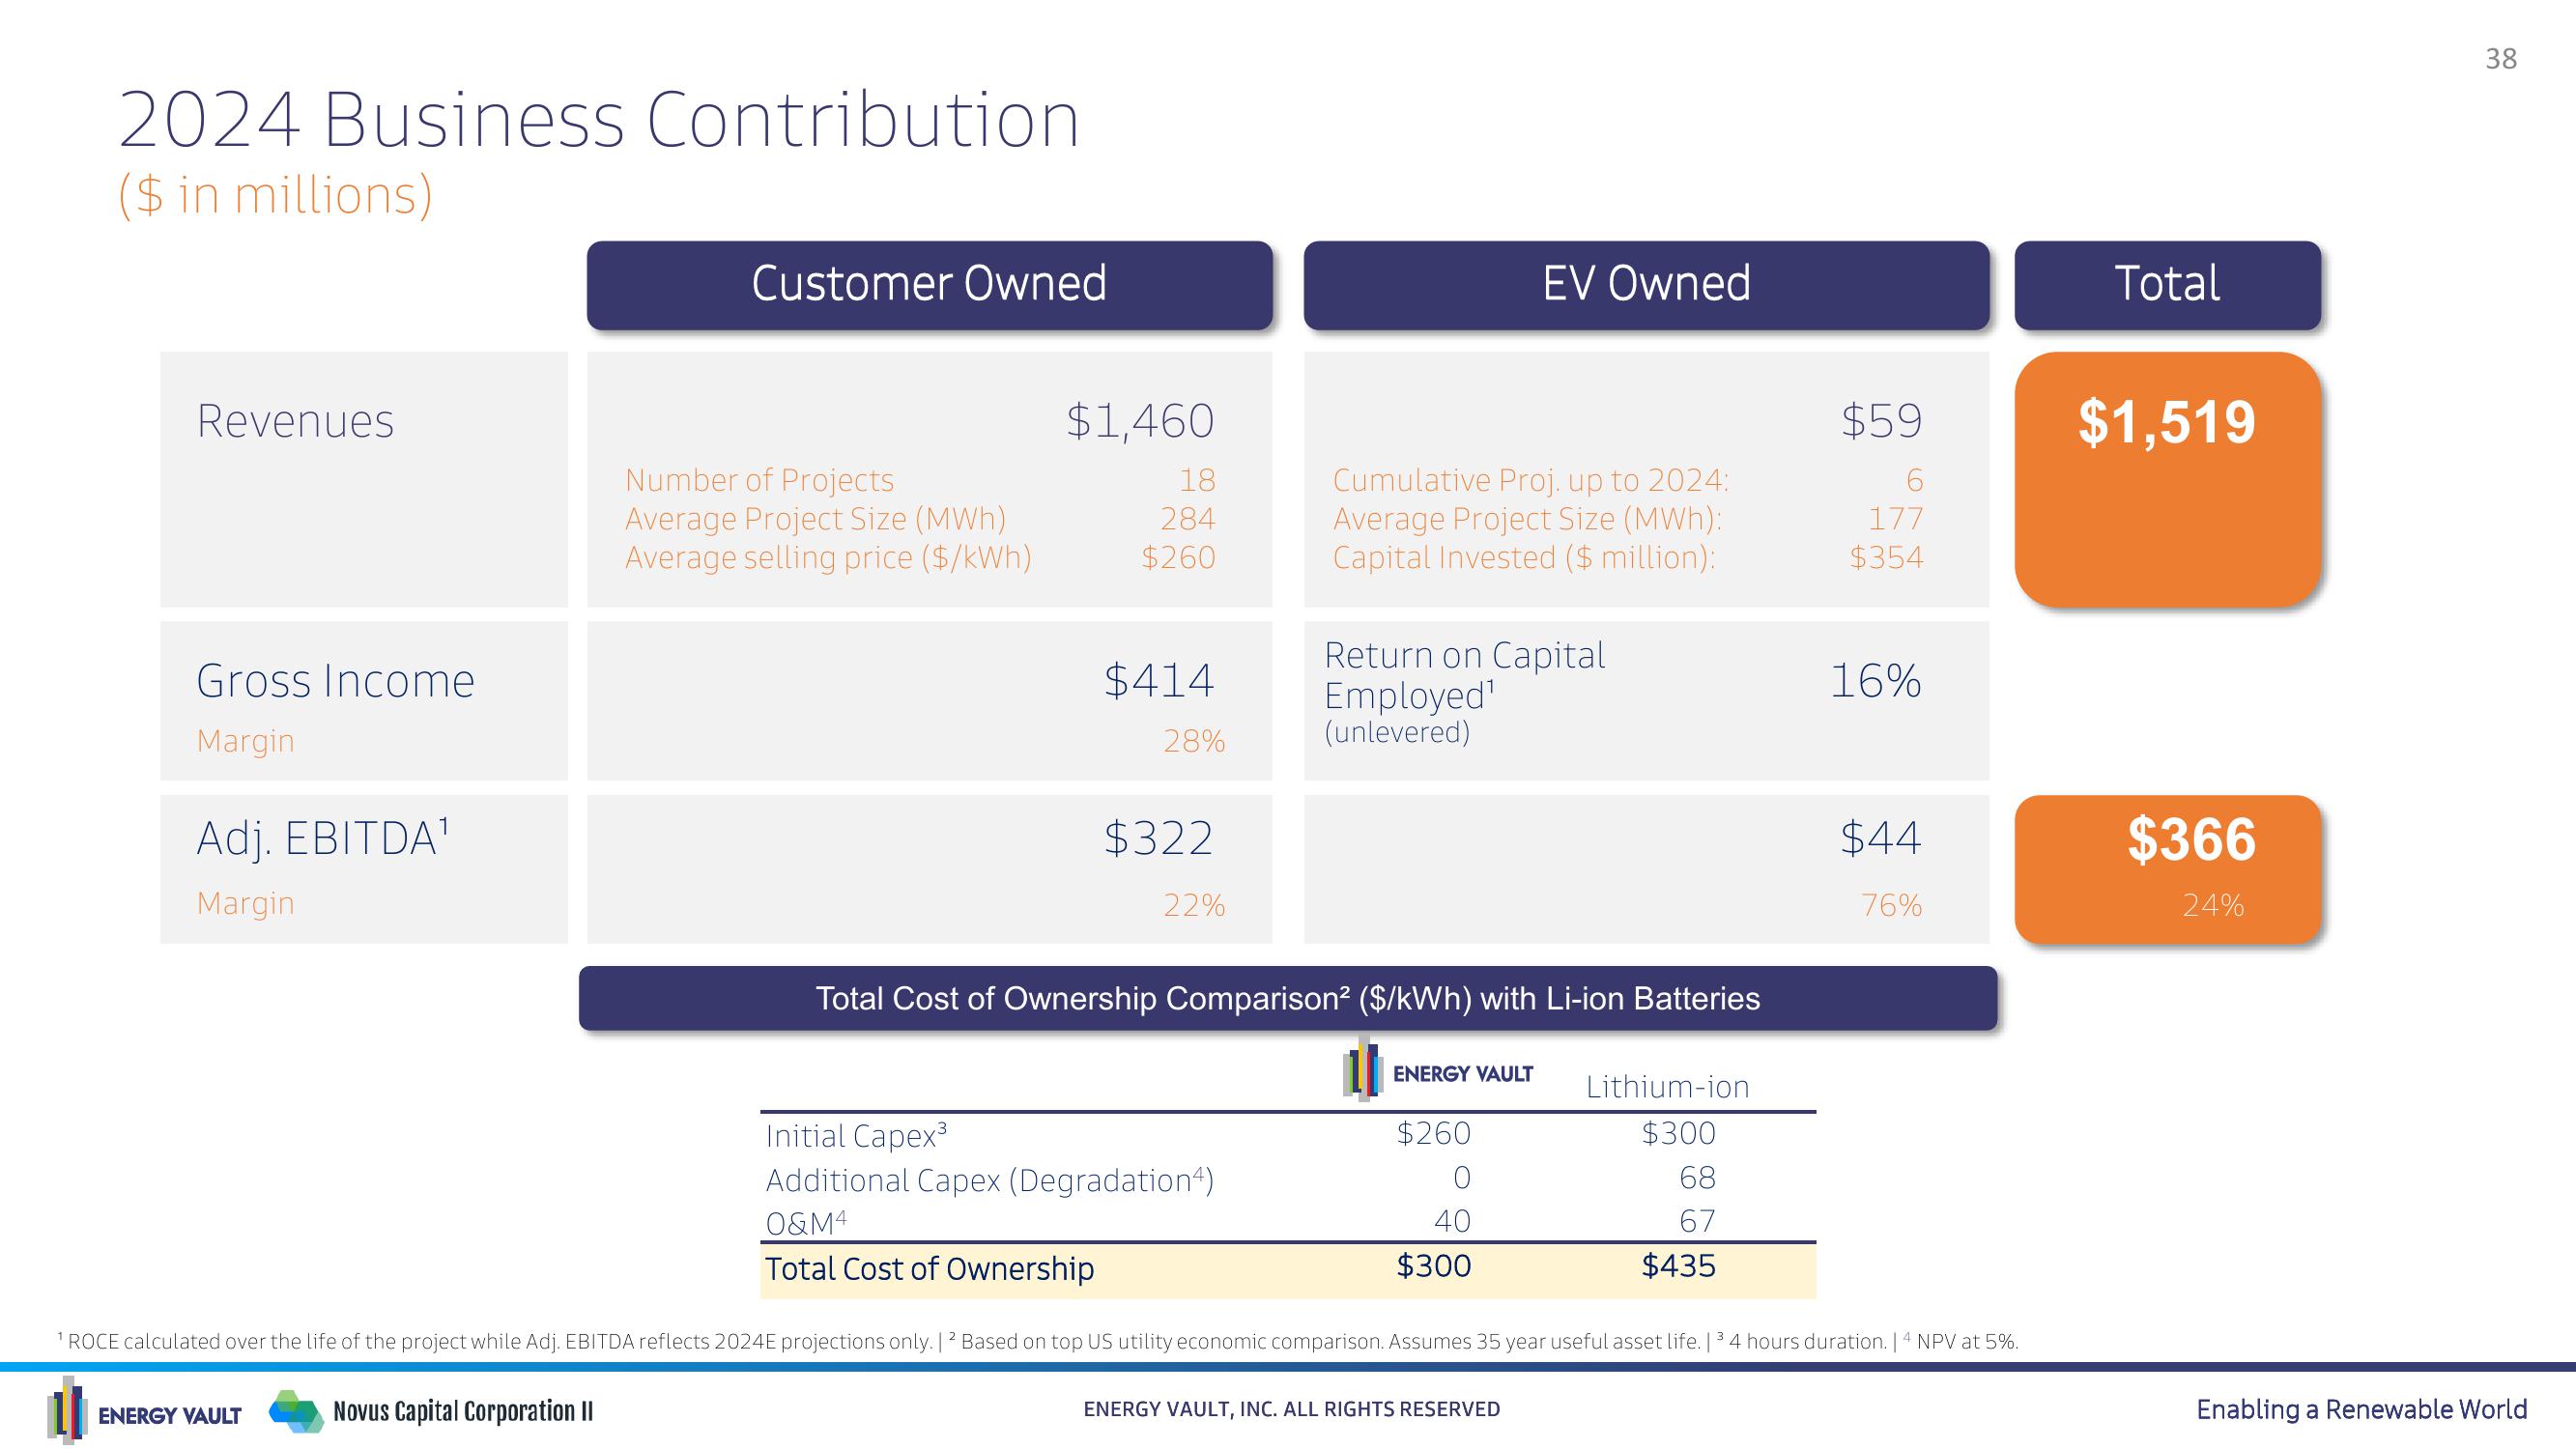
2024 Business Contribution
($ in millions)
Revenues
Gross Income
Margin
Adj. EBITDA¹
Margin
ENERGY VAULT
Customer Owned
Novus Capital Corporation II
Number of Projects
Average Project Size (MWh)
Average selling price ($/kWh)
$1,460
18
284
$260
$414
28%
$322
22%
Initial Capex³
Additional Capex (Degradation)
O&M4
Total Cost of Ownership
Cumulative Proj. up to 2024:
Average Project Size (MWh):
Capital Invested ($ million):
Return on Capital
Employed¹
(unlevered)
Total Cost of Ownership Comparison² ($/kWh) with Li-ion Batteries
EV Owned
ENERGY VAULT
$260
O
40
$300
ENERGY VAULT, INC. ALL RIGHTS RESERVED
Lithium-ion
$300
68
67
$435
$59
6
177
$354
¹ ROCE calculated over the life of the project while Adj. EBITDA reflects 2024E projections only. | 2 Based on top US utility economic comparison. Assumes 35 year useful asset life. | 34 hours duration. | 4 NPV at 5%.
16%
$44
76%
Total
$1,519
$366
24%
38
Enabling a Renewable WorldView entire presentation