Apollo Global Management Investor Day Presentation Deck
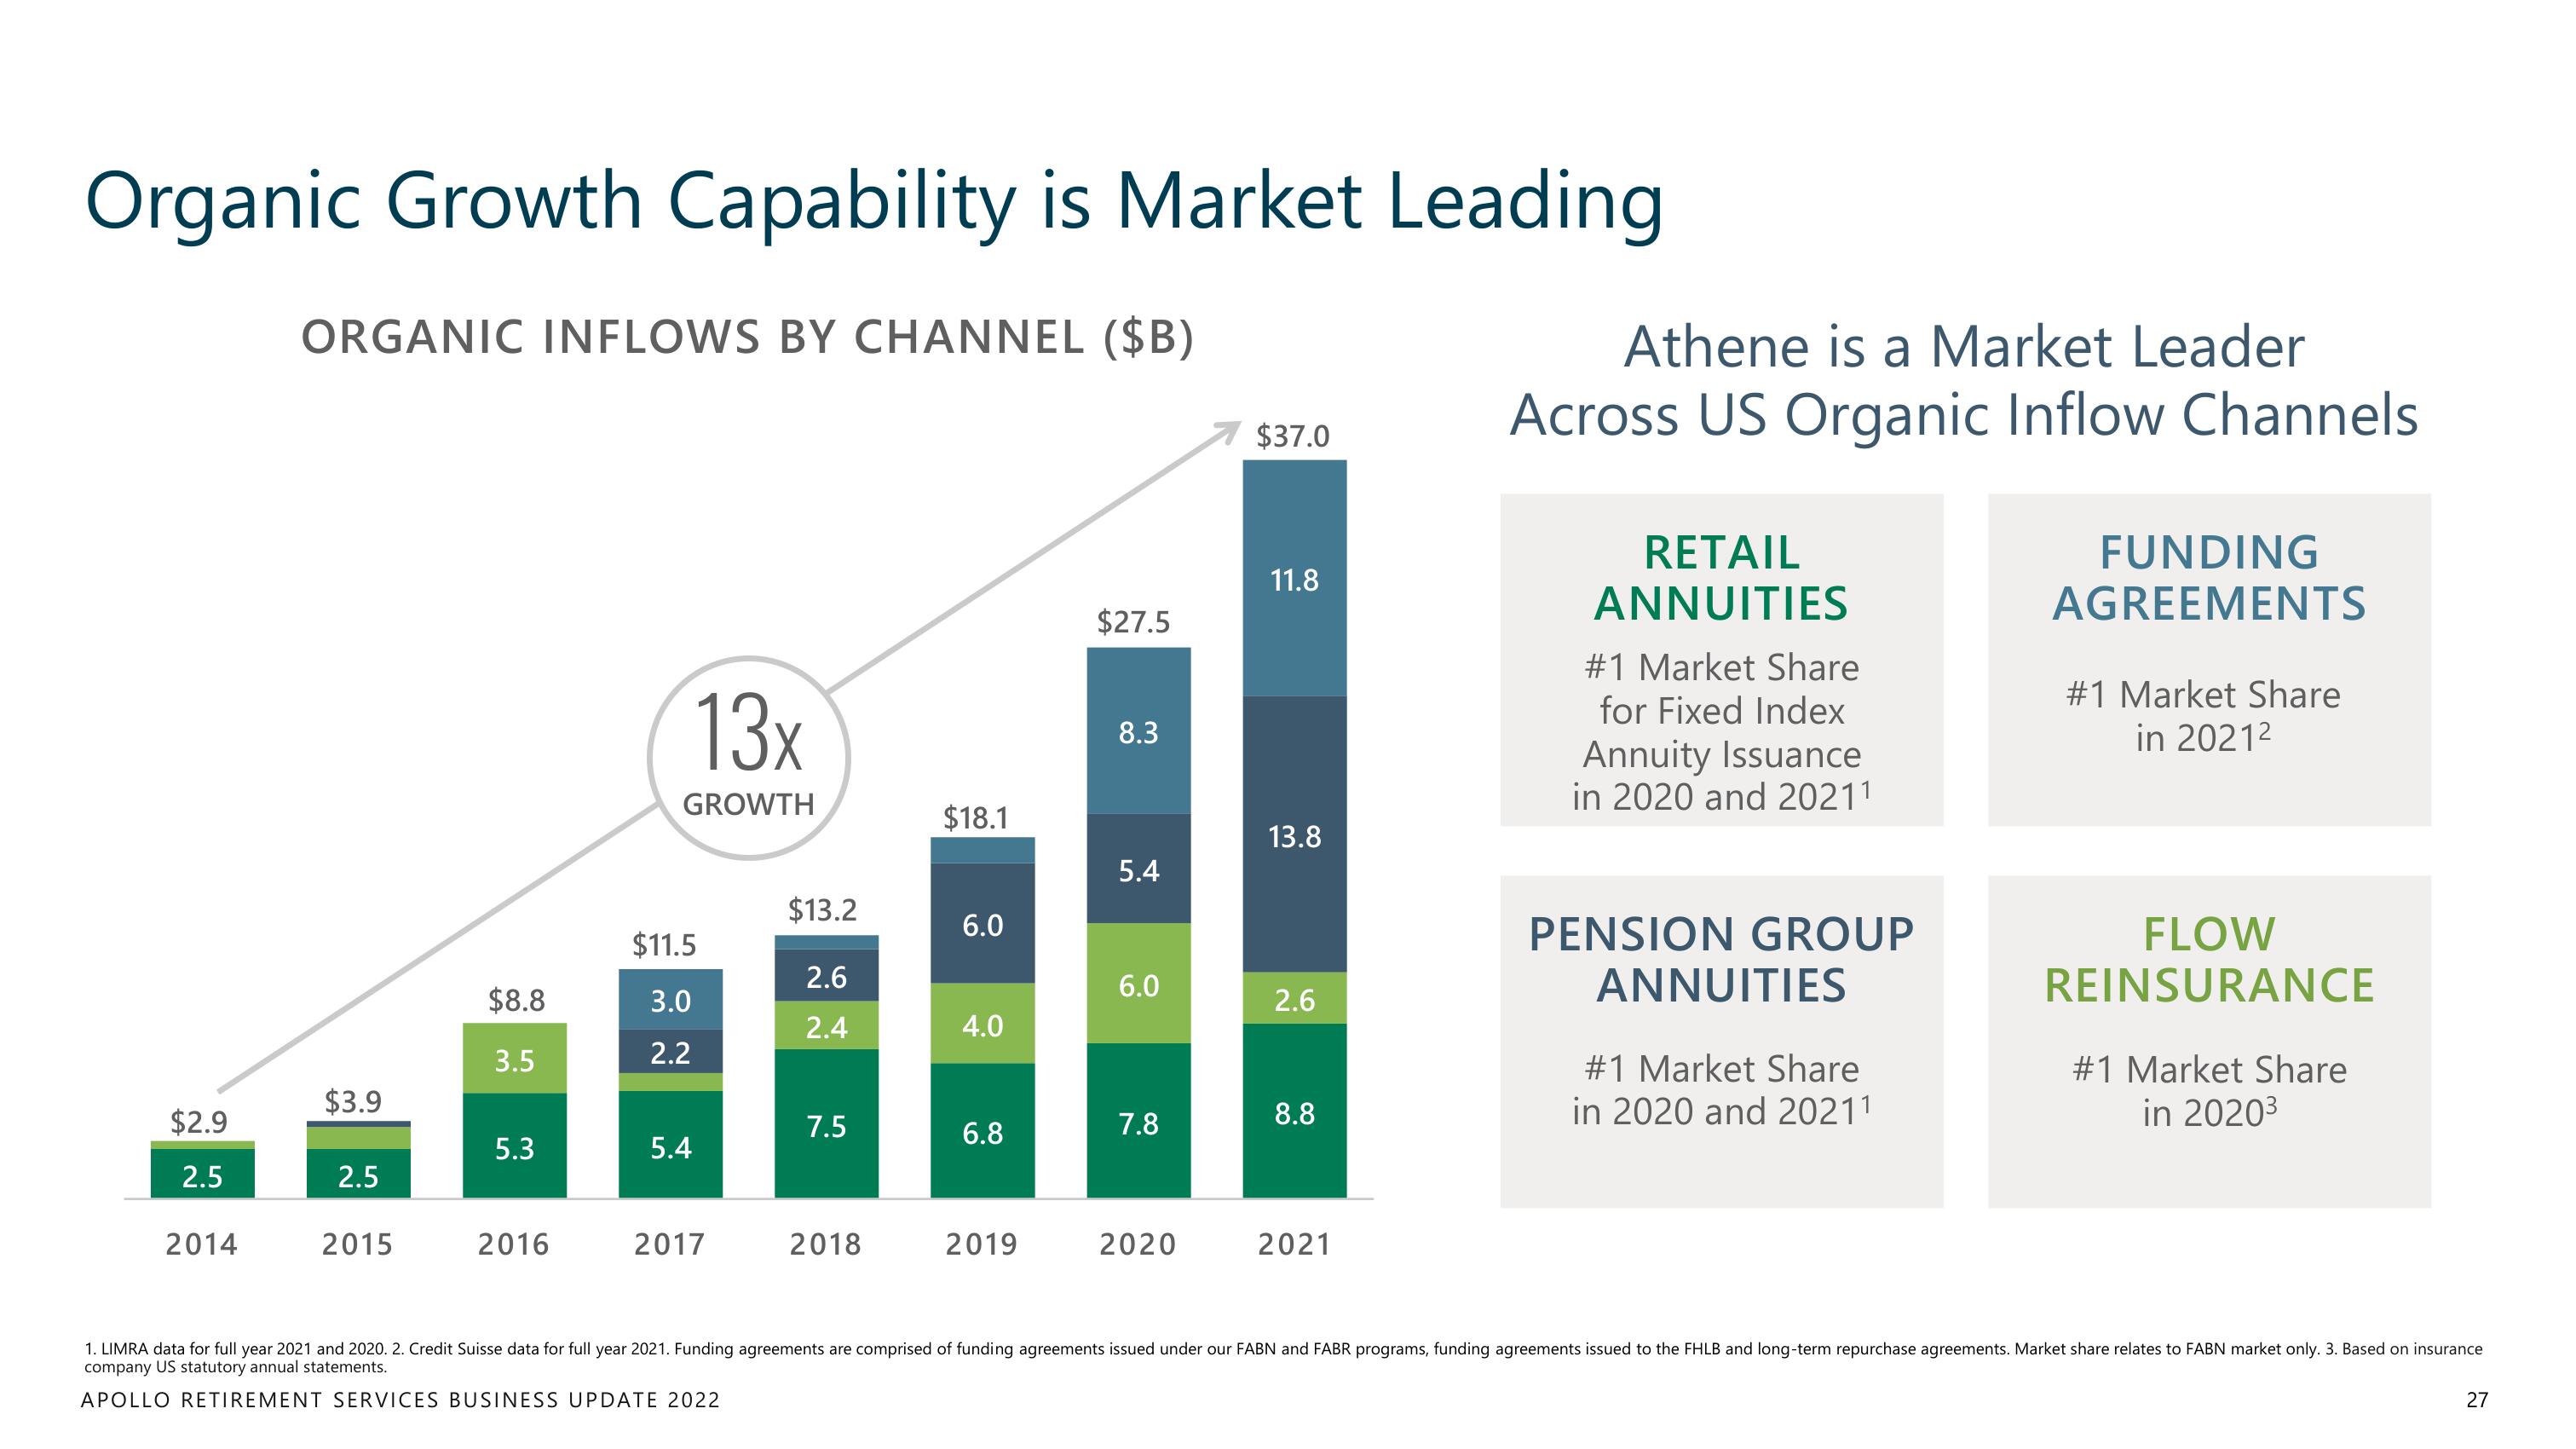
Organic Growth Capability is Market Leading
ORGANIC INFLOWS BY CHANNEL ($B)
$2.9
2.5
2014
$3.9
2.5
2015
$8.8
3.5
5.3
2016
13x
GROWTH
$11.5
3.0
2.2
5.4
2017
$13.2
2.6
2.4
7.5
2018
$18.1
6.0
4.0
6.8
2019
$27.5
8.3
5.4
6.0
7.8
2020
$37.0
11.8
13.8
2.6
8.8
2021
Athene is a Market Leader
Across US Organic Inflow Channels
RETAIL
ANNUITIES
#1 Market Share
for Fixed Index
Annuity Issuance
in 2020 and 20211
PENSION GROUP
ANNUITIES
#1 Market Share
in 2020 and 20211
FUNDING
AGREEMENTS
#1 Market Share
in 2021²
FLOW
REINSURANCE
#1 Market Share
in 2020³
1. LIMRA data for full year 2021 and 2020. 2. Credit Suisse data for full year 2021. Funding agreements are comprised of funding agreements issued under our FABN and FABR programs, funding agreements issued to the FHLB and long-term repurchase agreements. Market share relates to FABN market only. 3. Based on insurance
company US statutory annual statements.
APOLLO RETIREMENT SERVICES BUSINESS UPDATE 2022
27View entire presentation