Kinnevik Results Presentation Deck
Intro
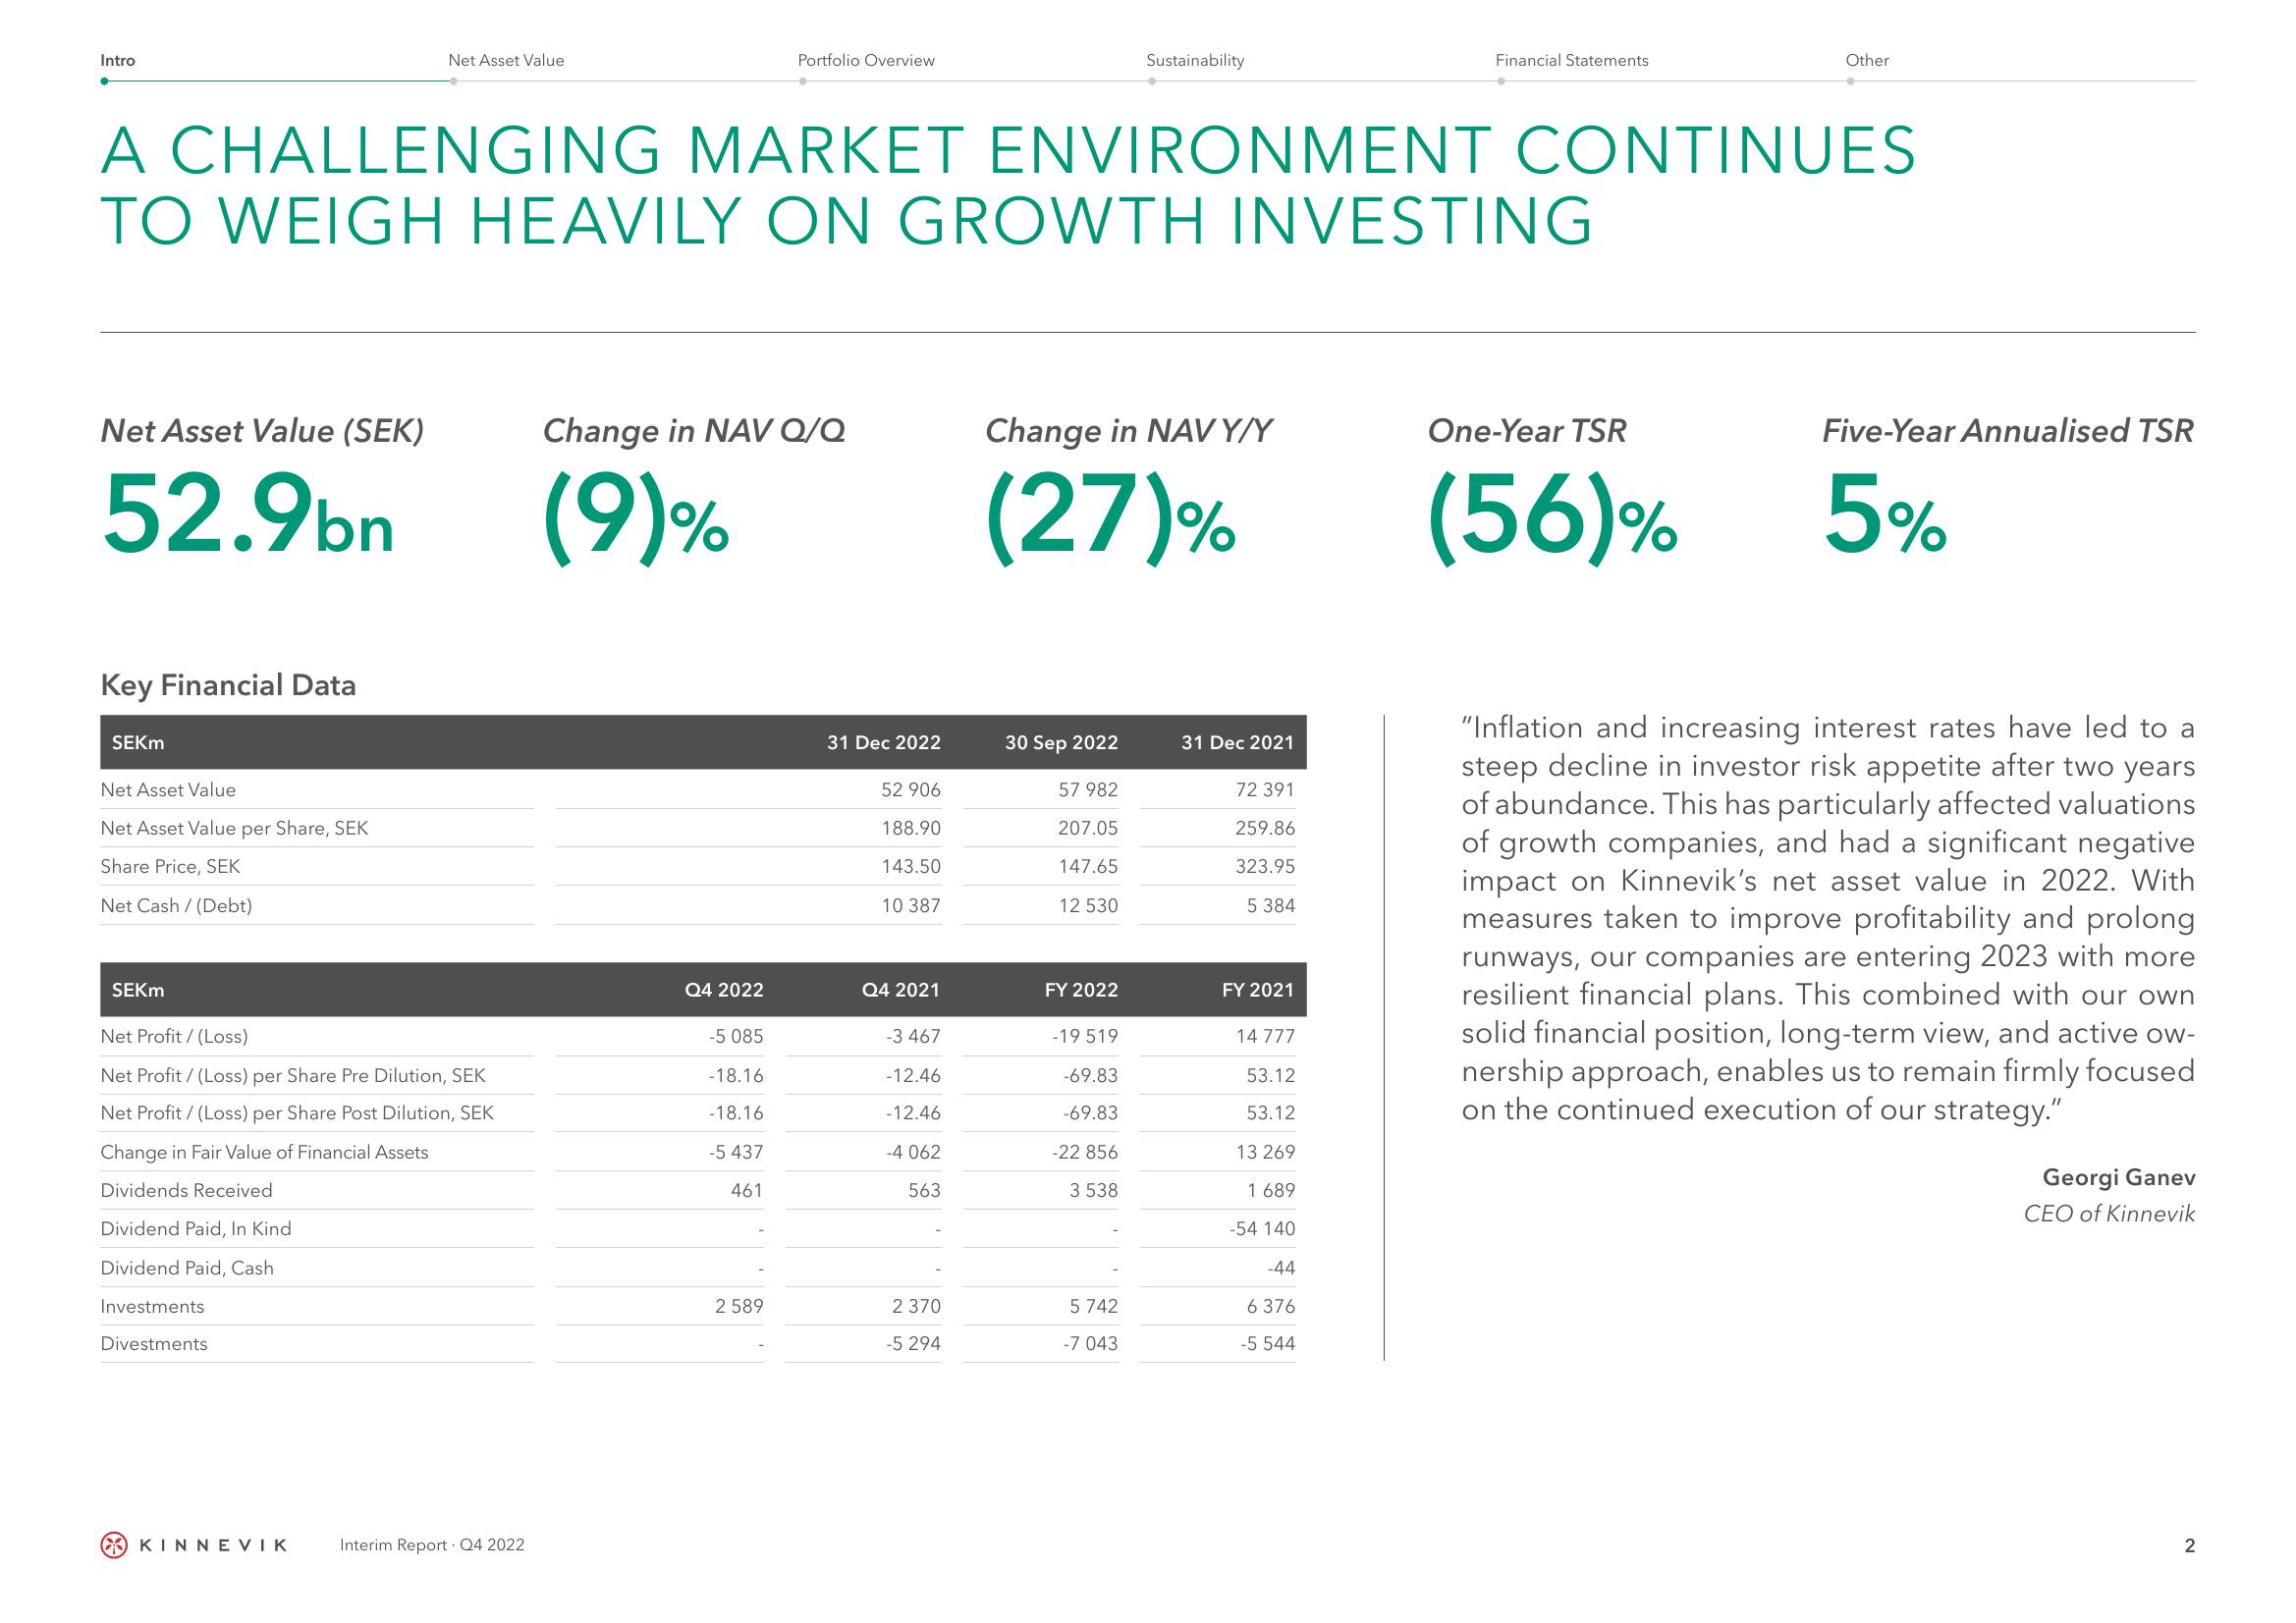
Net Asset Value (SEK)
52.9bn
Key Financial Data
SEKM
Net Asset Value
Net Asset Value per Share, SEK
Share Price, SEK
Net Cash/ (Debt)
A CHALLENGING MARKET ENVIRONMENT CONTINUES
TO WEIGH HEAVILY ON GROWTH INVESTING
SEKM
Net Asset Value
Net Profit/(Loss)
Net Profit / (Loss) per Share Pre Dilution, SEK
Net Profit / (Loss) per Share Post Dilution, SEK
Change in Fair Value of Financial Assets
Dividends Received
Dividend Paid, In Kind
Dividend Paid, Cash
Investments
Divestments
KINNEVIK
Interim Report. Q4 2022
Change in NAV Q/Q
(9)%
Q4 2022
Portfolio Overview
-5 085
-18.16
-18.16
-5 437
461
2 589
31 Dec 2022
52 906
188.90
143.50
10 387
Q4 2021
-3 467
-12.46
-12.46
-4 062
563
2 370
-5 294
Change in NAVY/Y
(27)%
30 Sep 2022
57 982
207.05
147.65
12 530
FY 2022
-19 519
Sustainability
-69.83
-69.83
-22 856
3 538
5 742
-7 043
31 Dec 2021
72 391
259.86
323.95
5 384
FY 2021
14 777
53.12
53.12
13 269
1 689
-54 140
Financial Statements
-44
6
376
-5 544
Other
One-Year TSR
(56)%
Five-Year Annualised TSR
5%
"Inflation and increasing interest rates have led to a
steep decline in investor risk appetite after two years
of abundance. This has particularly affected valuations
of growth companies, and had a significant negative
impact on Kinnevik's net asset value in 2022. With
measures taken to improve profitability and prolong
runways, our companies are entering 2023 with more
resilient financial plans. This combined with our own
solid financial position, long-term view, and active ow-
nership approach, enables us to remain firmly focused
on the continued execution of our strategy."
Georgi Ganev
CEO of Kinnevik
2View entire presentation