Bank of America Investment Banking Pitch Book
Preliminary Valuation Considerations
Preliminary Discounted Cash Flow Analysis
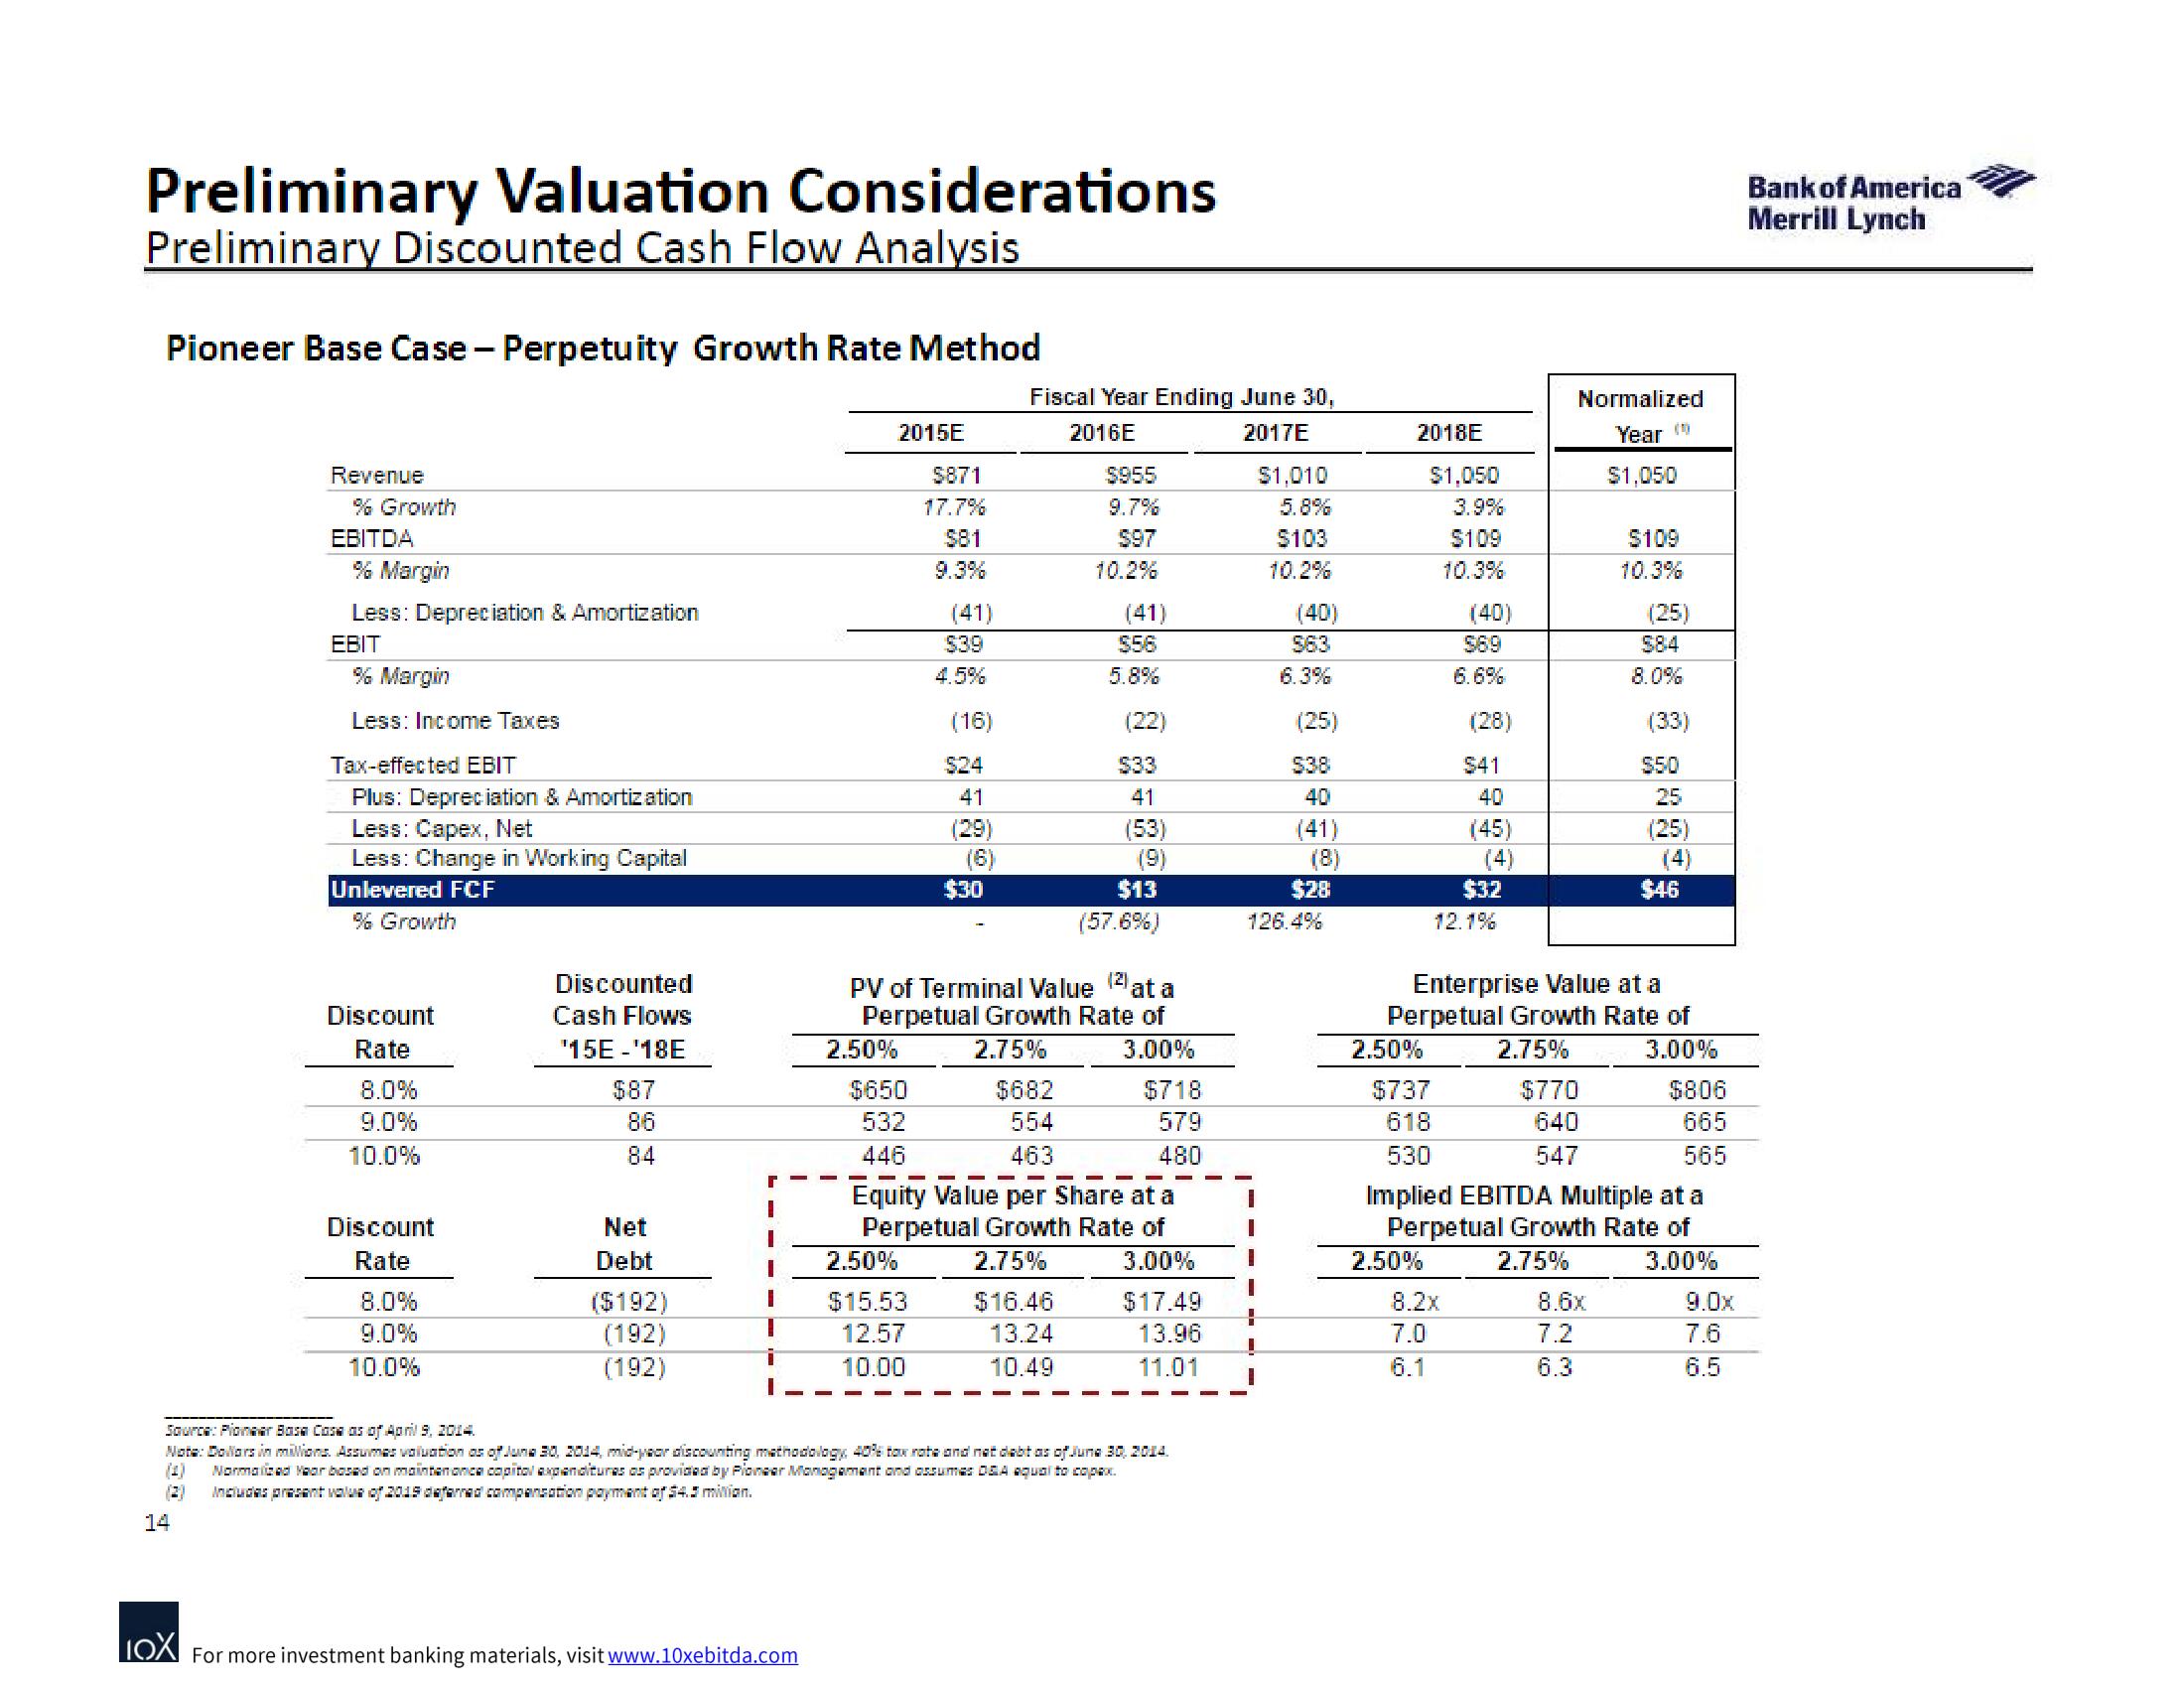
Pioneer Base Case - Perpetuity Growth Rate Method
Revenue
14
% Growth
EBITDA
% Margin
Less: Depreciation & Amortization
EBIT
% Margin
Less: Income Taxes
Tax-effected EBIT
Plus: Depreciation & Amortization
Less: Capex, Net
Less: Change in Working Capital
Unlevered FCF
% Growth
Discount
Rate
8.0%
9.0%
10.0%
Discount
Rate
8.0%
9.0%
10.0%
Discounted
Cash Flows
¹15E - ¹18E
$87
86
84
Net
Debt
($192)
(192)
(192)
r
LOX For more investment banking materials, visit www.10xebitda.com
2015E
2.50%
$650
532
446
$871
17.7%
$81
(41)
2.50%
$15.53
12.57
10.00
$39
4.5%
(16)
$24
41
(29)
$30
Fiscal Year Ending June 30,
2016E
2017E
$682
554
463
$955
9.7%
597
10.2%
(41)
PV of Terminal Value at a
Perpetual Growth Rate of
2.75%
3.00%
$16.46
13.24
10.49
$56
5.8%
(22)
$33
41
(53)
(9)
$13
(57.6%)
Equity Value per Share at a
Perpetual Growth Rate of
2.75%
3.00%
$718
579
480
Source: Pioneer Base Cosa as of April 9, 2014.
Note: Dollars in millions. Assumes valuation as of June 30, 2014, mid-year discounting methodology, 40% tax rate and net debt as of June 30, 2014.
(1) Normalized Year based on maintenance capital expenditures as provided by Pioneer Management and assumes DSA equal to copax.
Includes present value of 2019 diaferrad compensation payment of $4.3 milion.
$17.49
13.96
11.01
$1,010
5.8%
$103
10.2%
I
1
(40)
563
6.3%
(25)
$38
40
(41)
$28
126.4%
2018E
2.50%
$1,050
3.9%
$109
10.3%
$737
618
530
2.50%
(40)
$69
6.6%
(28)
8.2x
7.0
6.1
$41
40
(45)
(4)
$32
12.1%
Normalized
Year (
$770
640
547
$1,050
$109
Enterprise Value at a
Perpetual Growth Rate of
2.75%
3.00%
8.6x
7.2
6.3
(25)
S84
8.0%
(33)
$50
25
(25)
$46
Implied EBITDA Multiple at a
Perpetual Growth Rate of
2.75%
3.00%
$806
665
565
9.0x
7.6
6.5
(100
Bank of America
Merrill LynchView entire presentation