Carlyle Investor Conference Presentation Deck
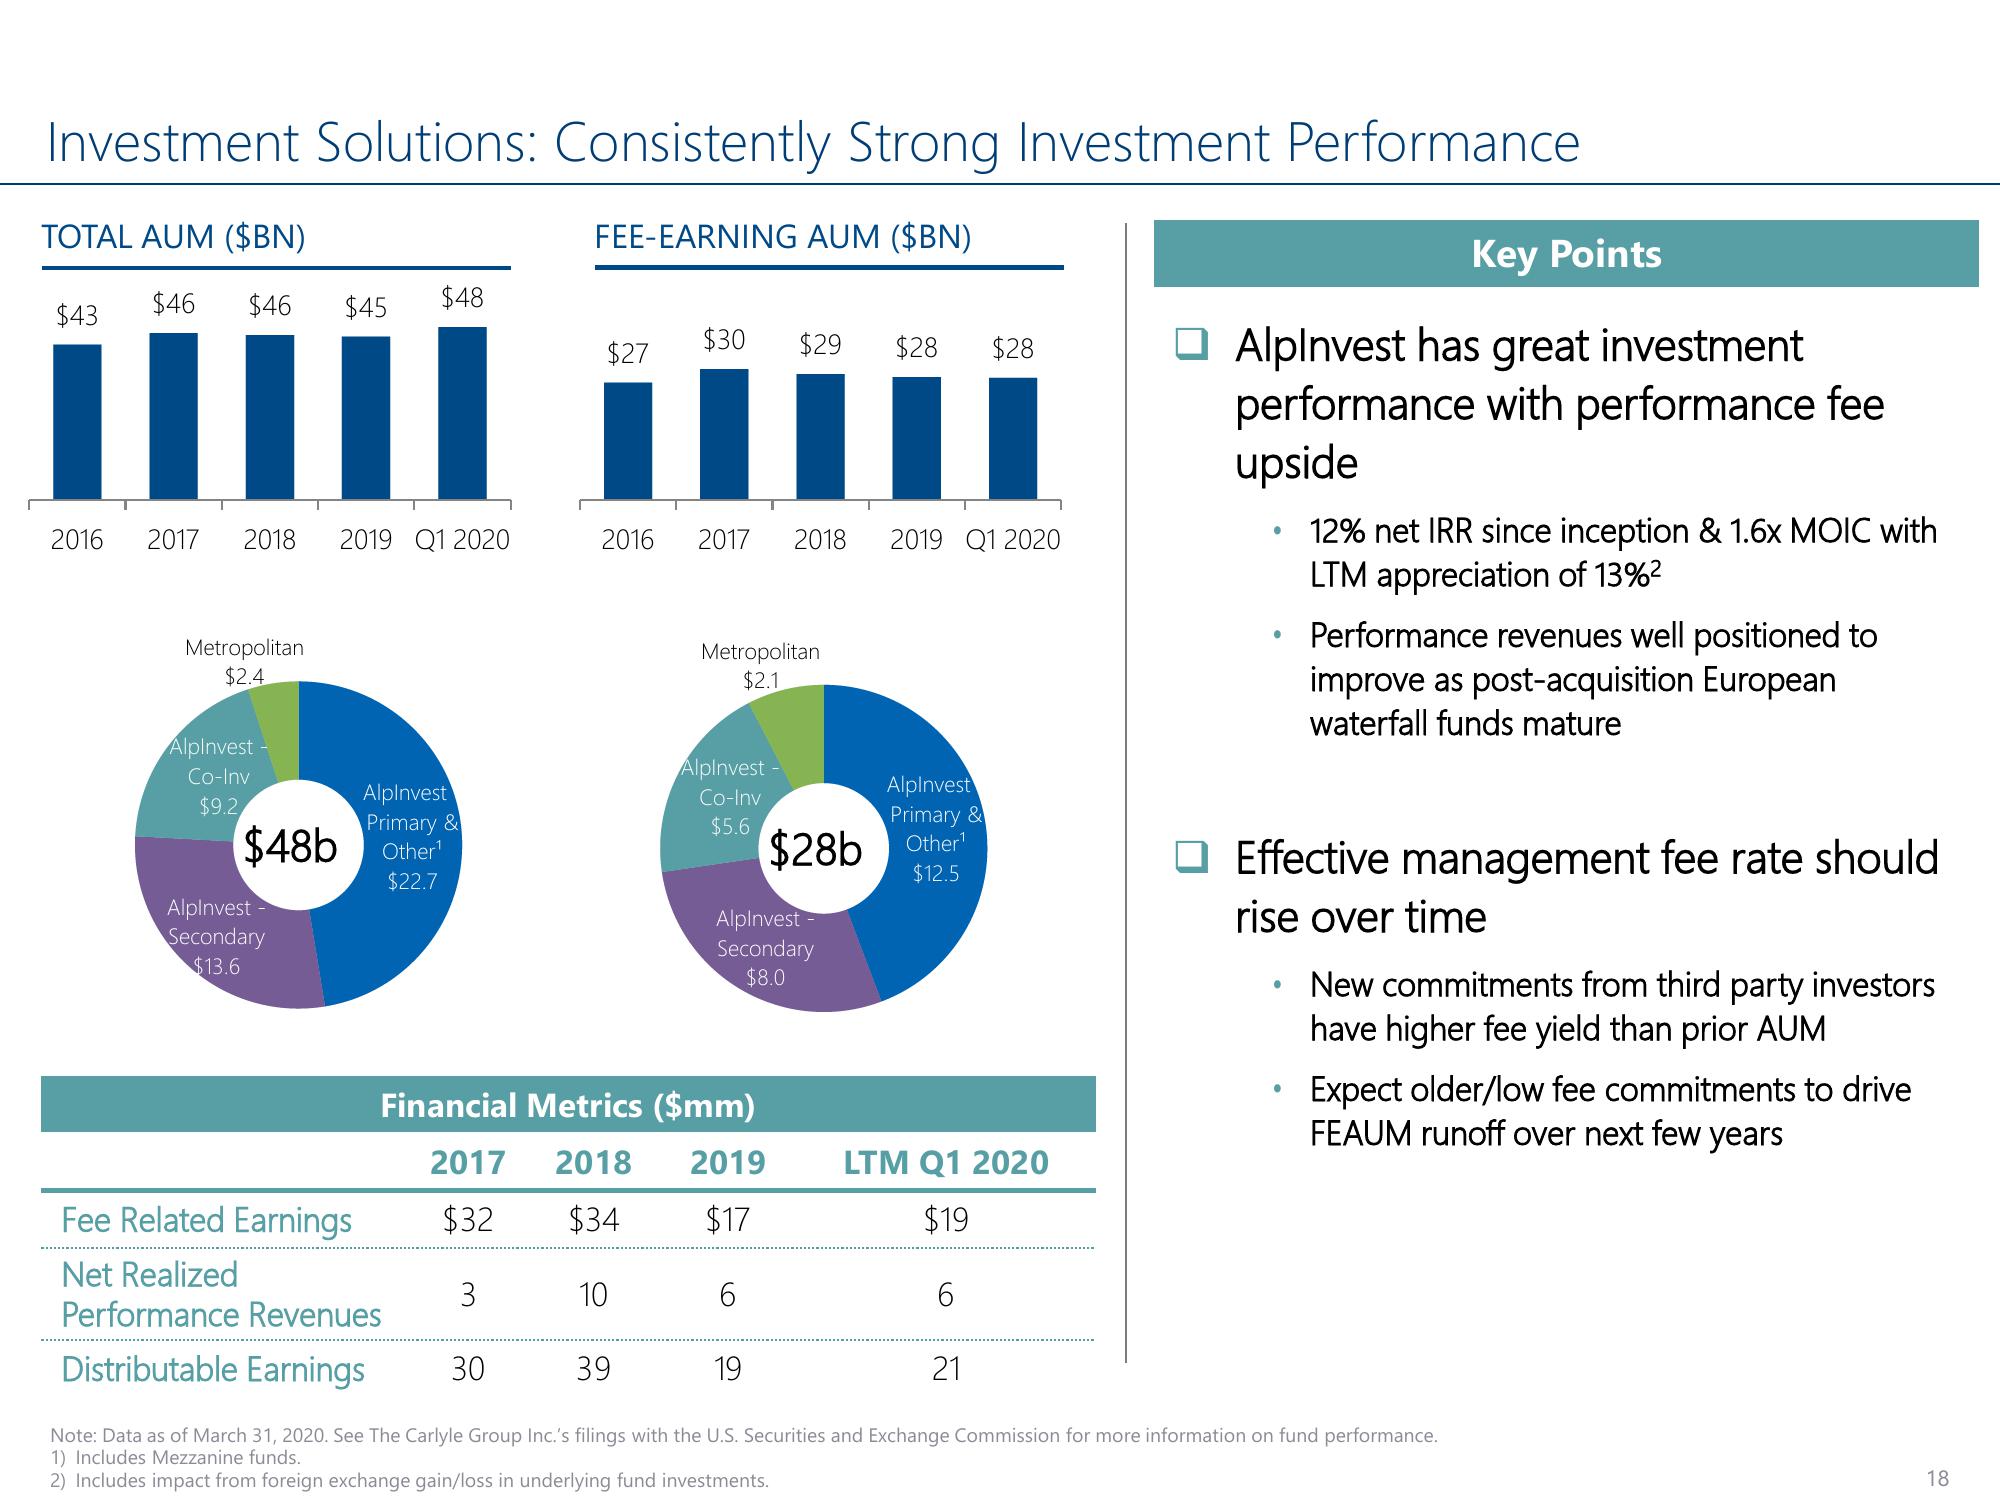
Investment Solutions: Consistently Strong Investment Performance
TOTAL AUM ($BN)
FEE-EARNING AUM ($BN)
$46
$43
2016
$46 $45 $48
2017 2018 2019 Q1 2020
Metropolitan
$2.4
Alpinvest
Co-Inv
$9.2
$48b
Alpinvest -
Secondary
$13.6
AlpInvest
Primary &
Other¹
$22.7
$27
Fee Related Earnings
Net Realized
Performance Revenues
Distributable Earnings
2016
$30
2017 2018 2019 Q1 2020
Metropolitan
$2.1
AlpInvest -
Co-Inv
$5.6
$29 $28 $28
Financial Metrics ($mm)
2017 2018 2019
$32 $34
$17
3
10
30
AlpInvest
Secondary
$8.0
6
$28b
AlpInvest
Primary &
Other¹
$12.5
LTM Q1 2020
$19
6
Key Points
AlpInvest has great investment
performance with performance fee
upside
12% net IRR since inception & 1.6x MOIC with
LTM appreciation of 13%²
21
●
●
Performance revenues well positioned to
improve as post-acquisition European
waterfall funds mature
Effective management fee rate should
rise over time
●
New commitments from third party investors
have higher fee yield than prior AUM
Expect older/low fee commitments to drive
FEAUM runoff over next few years
39
19
Note: Data as of March 31, 2020. See The Carlyle Group Inc.'s filings with the U.S. Securities and Exchange Commission for more information on fund performance.
1) Includes Mezzanine funds.
2) Includes impact from foreign exchange gain/loss in underlying fund investments.
18View entire presentation