Apollo Global Management Investor Presentation Deck
Drivers of Apollo Business
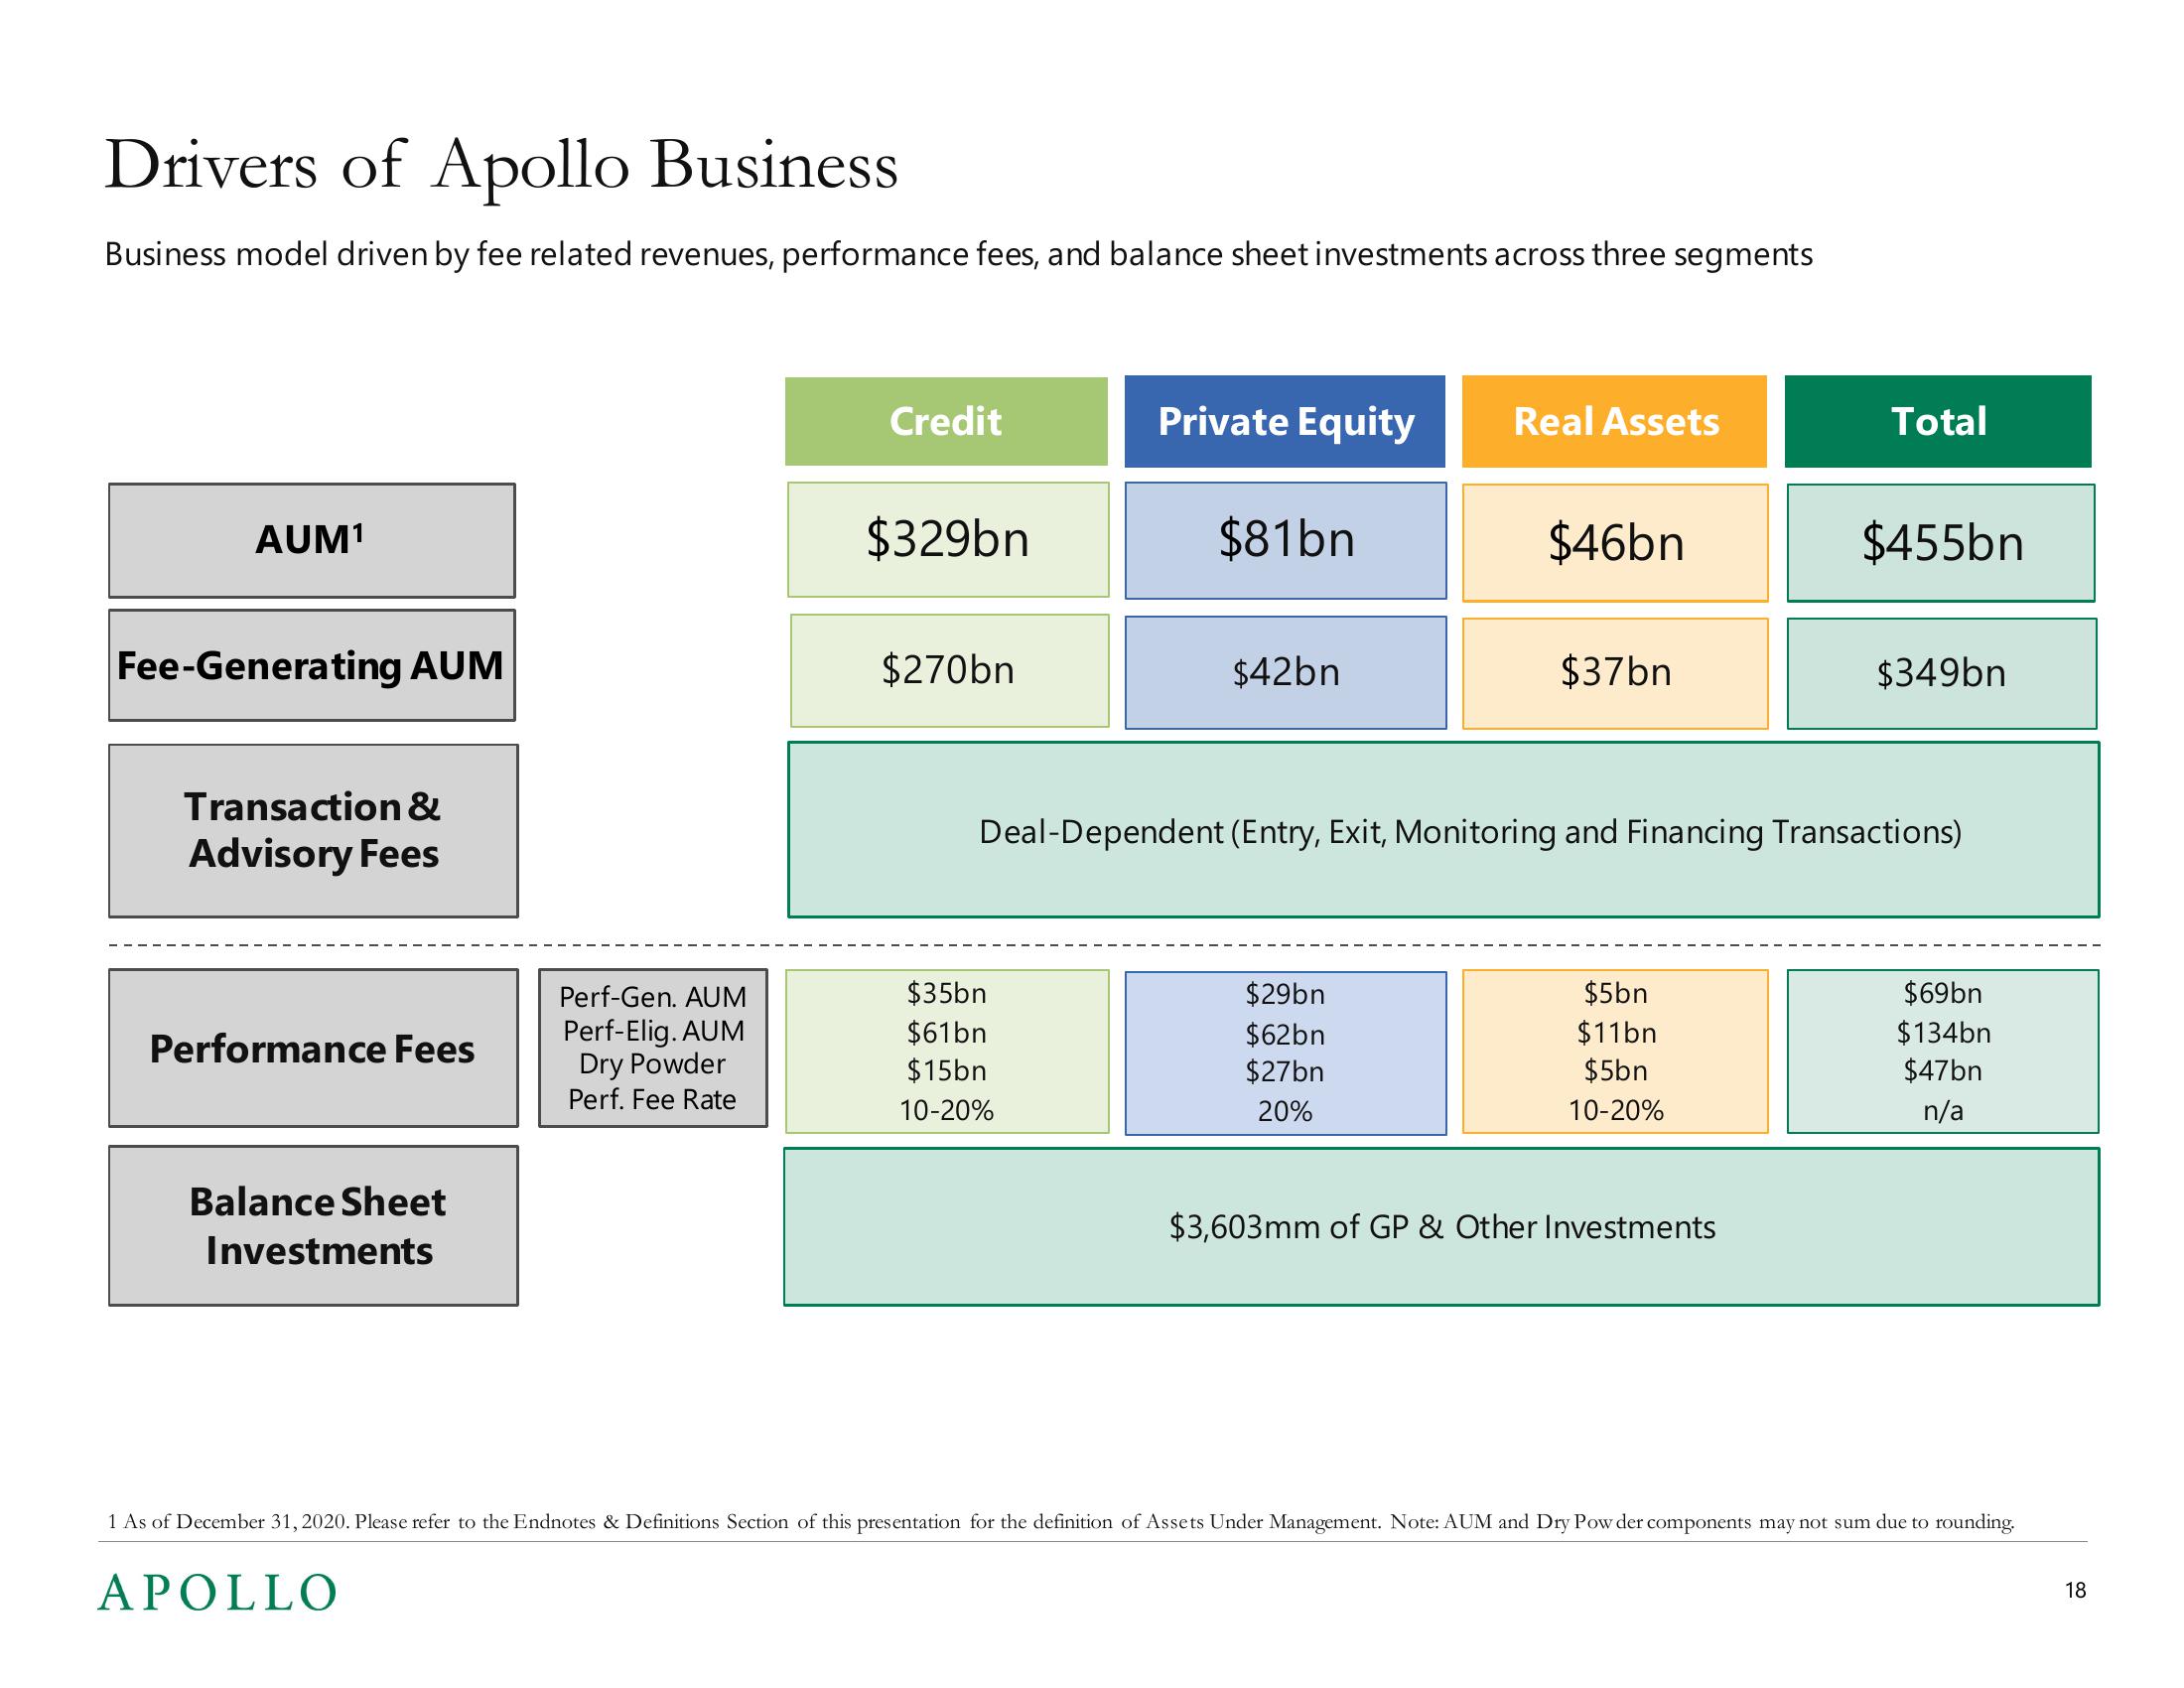
Business model driven by fee related revenues, performance fees, and balance sheet investments across three segments
AUM¹
Fee-Generating AUM
Transaction &
Advisory Fees
Performance Fees
Balance Sheet
Investments
Perf-Gen. AUM
Perf-Elig. AUM
Dry Powder
Perf. Fee Rate
APOLLO
Credit
$329bn
$270bn
Private Equity
$35bn
$61bn
$15bn
10-20%
$81bn
$42bn
Real Assets
$29bn
$62bn
$27bn
20%
$46bn
$37bn
Deal-Dependent (Entry, Exit, Monitoring and Financing Transactions)
$5bn
$11bn
$5bn
10-20%
Total
$3,603mm of GP & Other Investments
$455bn
$349bn
$69bn
$134bn
$47bn
n/a
1 As of December 31, 2020. Please refer to the Endnotes & Definitions Section of this presentation for the definition of Assets Under Management. Note: AUM and Dry Powder components may not sum due to rounding.
18View entire presentation