Uber Results Presentation Deck
Continued:
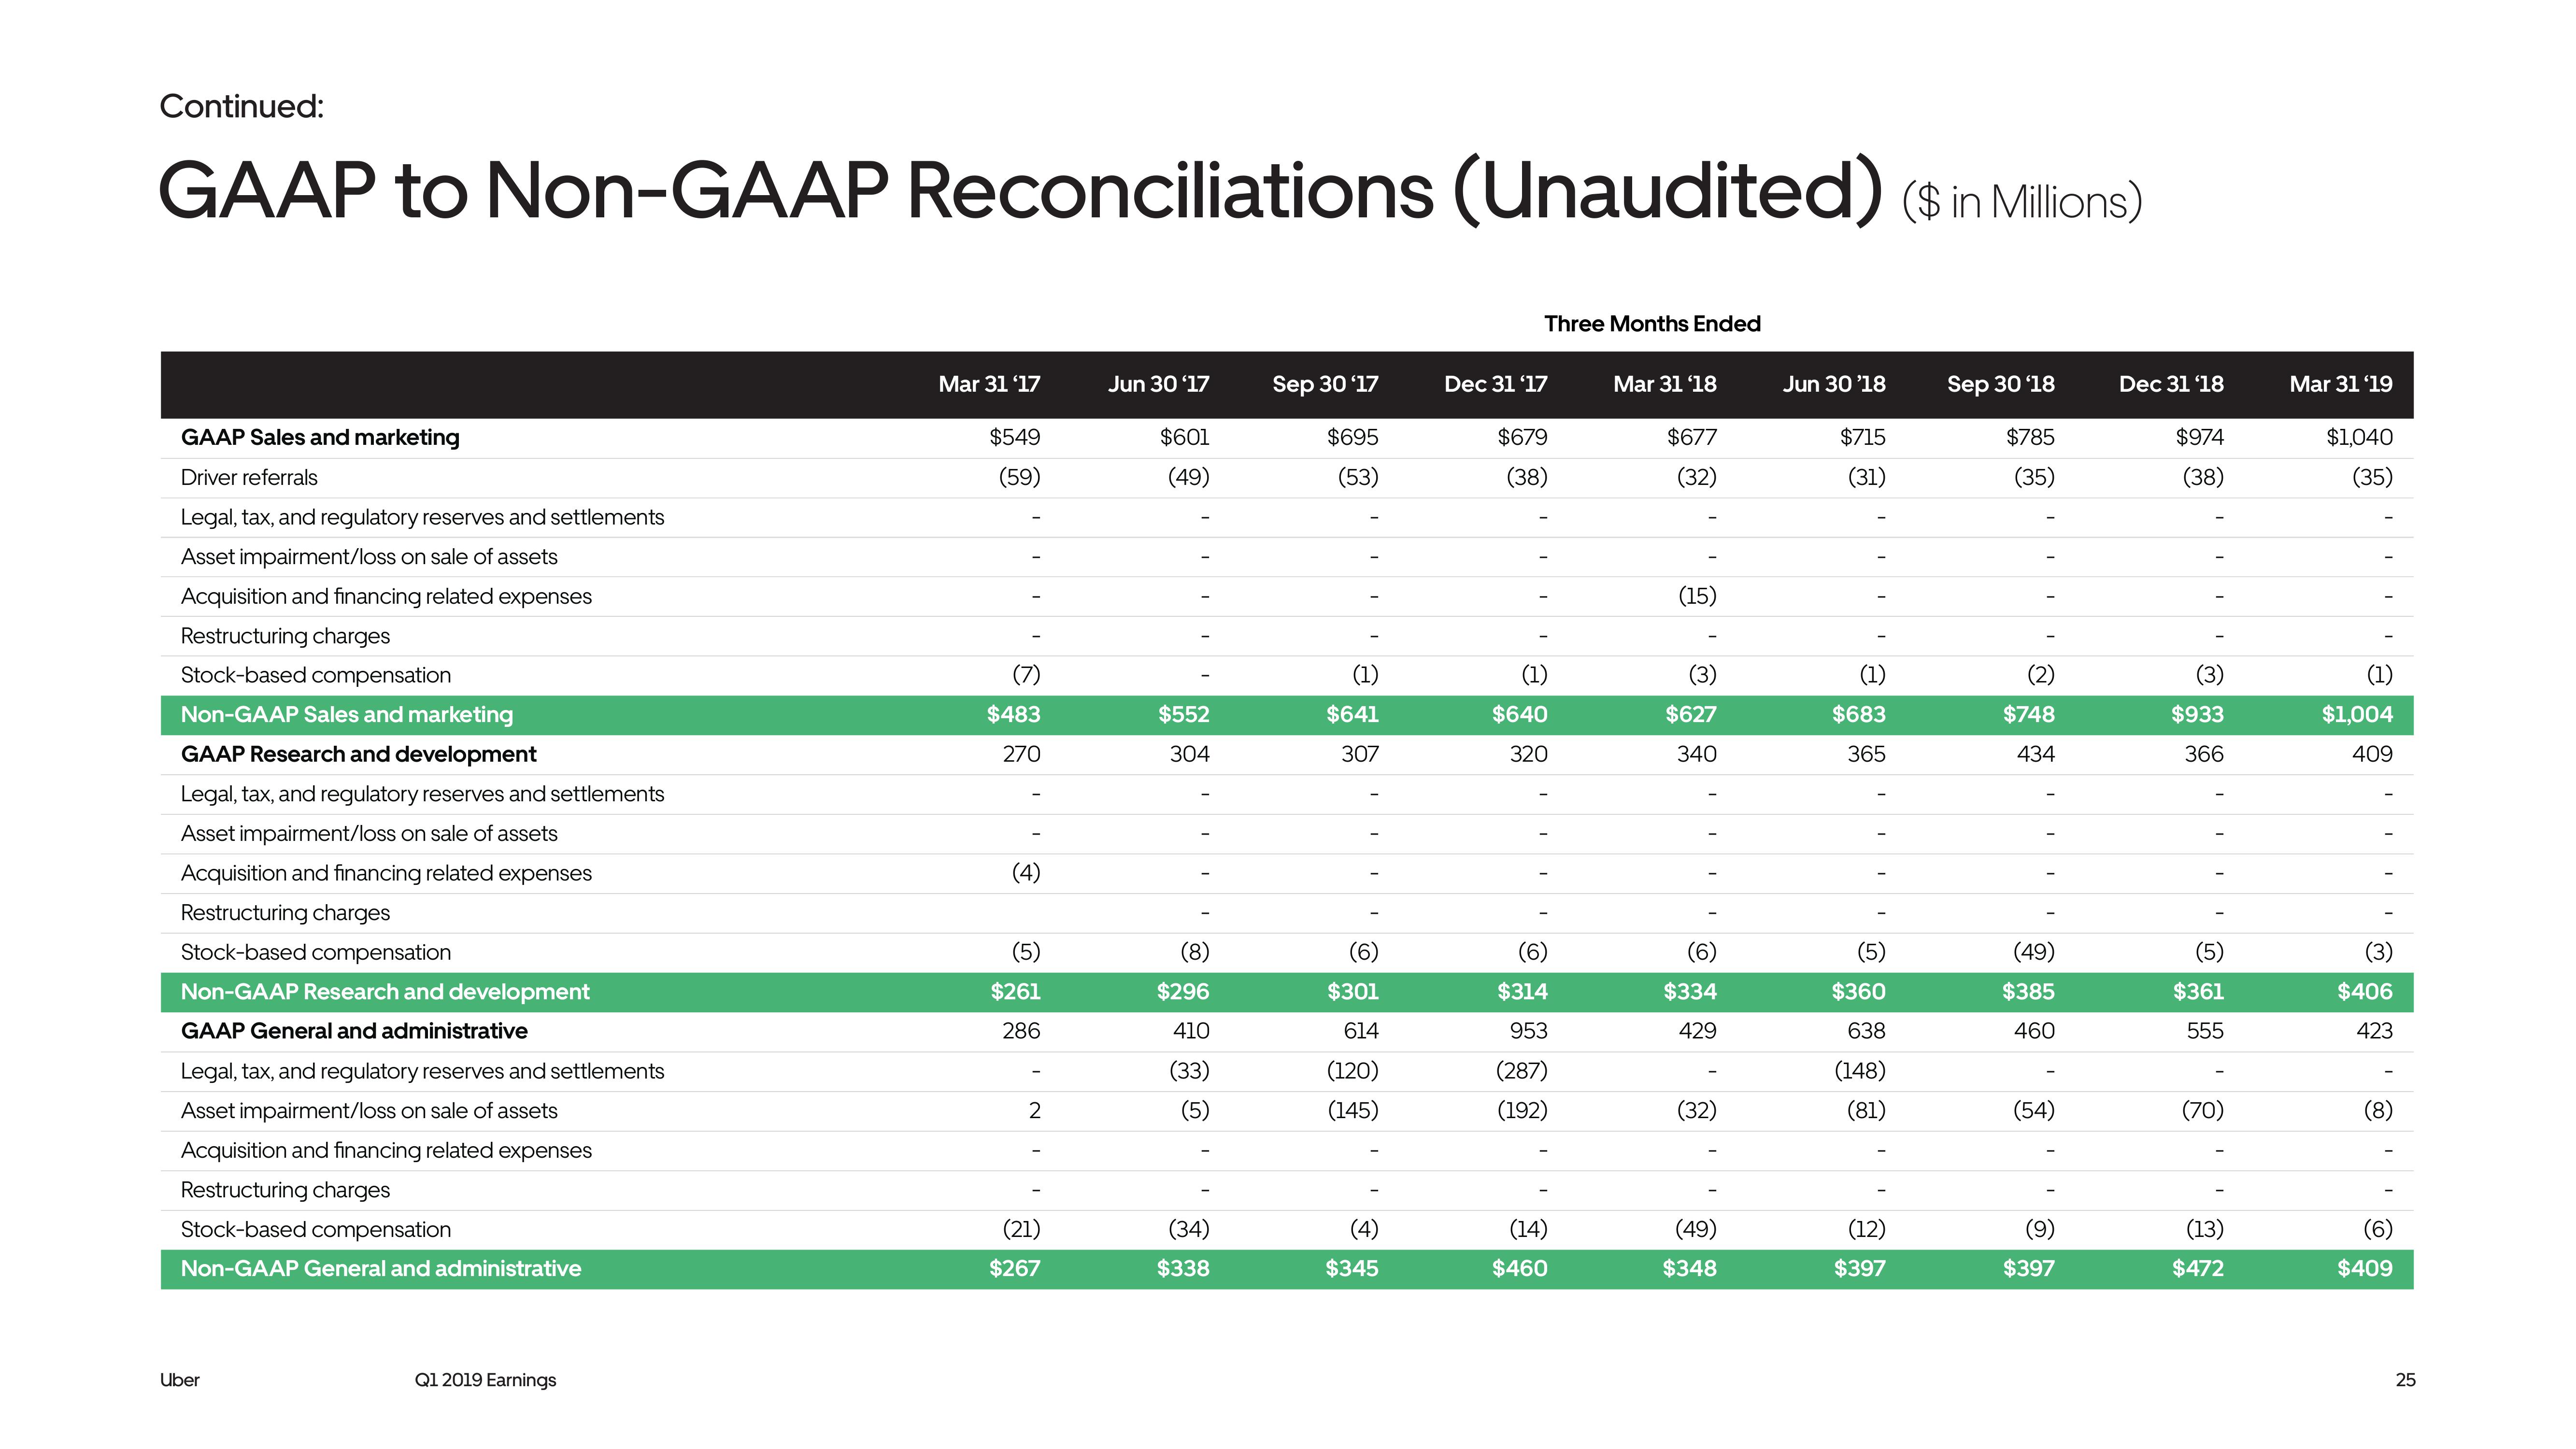
GAAP to Non-GAAP Reconciliations (Unaudited) ($ in Millions)
GAAP Sales and marketing
Driver referrals
Legal, tax, and regulatory reserves and settlements
Asset impairment/loss on sale of assets
Acquisition and financing related expenses
Restructuring charges
Stock-based compensation
Non-GAAP Sales and marketing
GAAP Research and development
Legal, tax, and regulatory reserves and settlements
Asset impairment/loss on sale of assets
Acquisition and financing related expenses
Restructuring charges
Stock-based compensation
Non-GAAP Research and development
GAAP General and administrative
Legal, tax, and regulatory reserves and settlements
Asset impairment/loss on sale of assets
Acquisition and financing related expenses
Restructuring charges
Stock-based compensation
Non-GAAP General and administrative
Uber
Q1 2019 Earnings
Mar 31 '17
$549
(59)
(7)
$483
270
(4)
(5)
$261
286
2
(21)
$267
Jun 30 '17
$601
(49)
$552
304
(8)
$296
410
(33)
(5)
(34)
$338
Sep 30 '17
$695
(53)
(1)
$641
307
(6)
$301
614
(120)
(145)
(4)
$345
Three Months Ended
Dec 31 '17
$679
(38)
(1)
$640
320
(6)
$314
953
(287)
(192)
(14)
$460
Mar 31 '18
$677
(32)
(15)
(3)
$627
340
(6)
$334
429
(32)
(49)
$348
Jun 30 '18
$715
(31)
(1)
$683
365
(5)
$360
638
(148)
(81)
(12)
$397
Sep 30'18
$785
(35)
(2)
$748
434
(49)
$385
460
(54)
(9)
$397
Dec 31 '18
$974
(38)
(3)
$933
366
(5)
$361
555
(70)
(13)
$472
Mar 31 '19
$1,040
(35)
(1)
$1,004
409
(3)
$406
423
(8)
(6)
$409
25View entire presentation