Selina SPAC
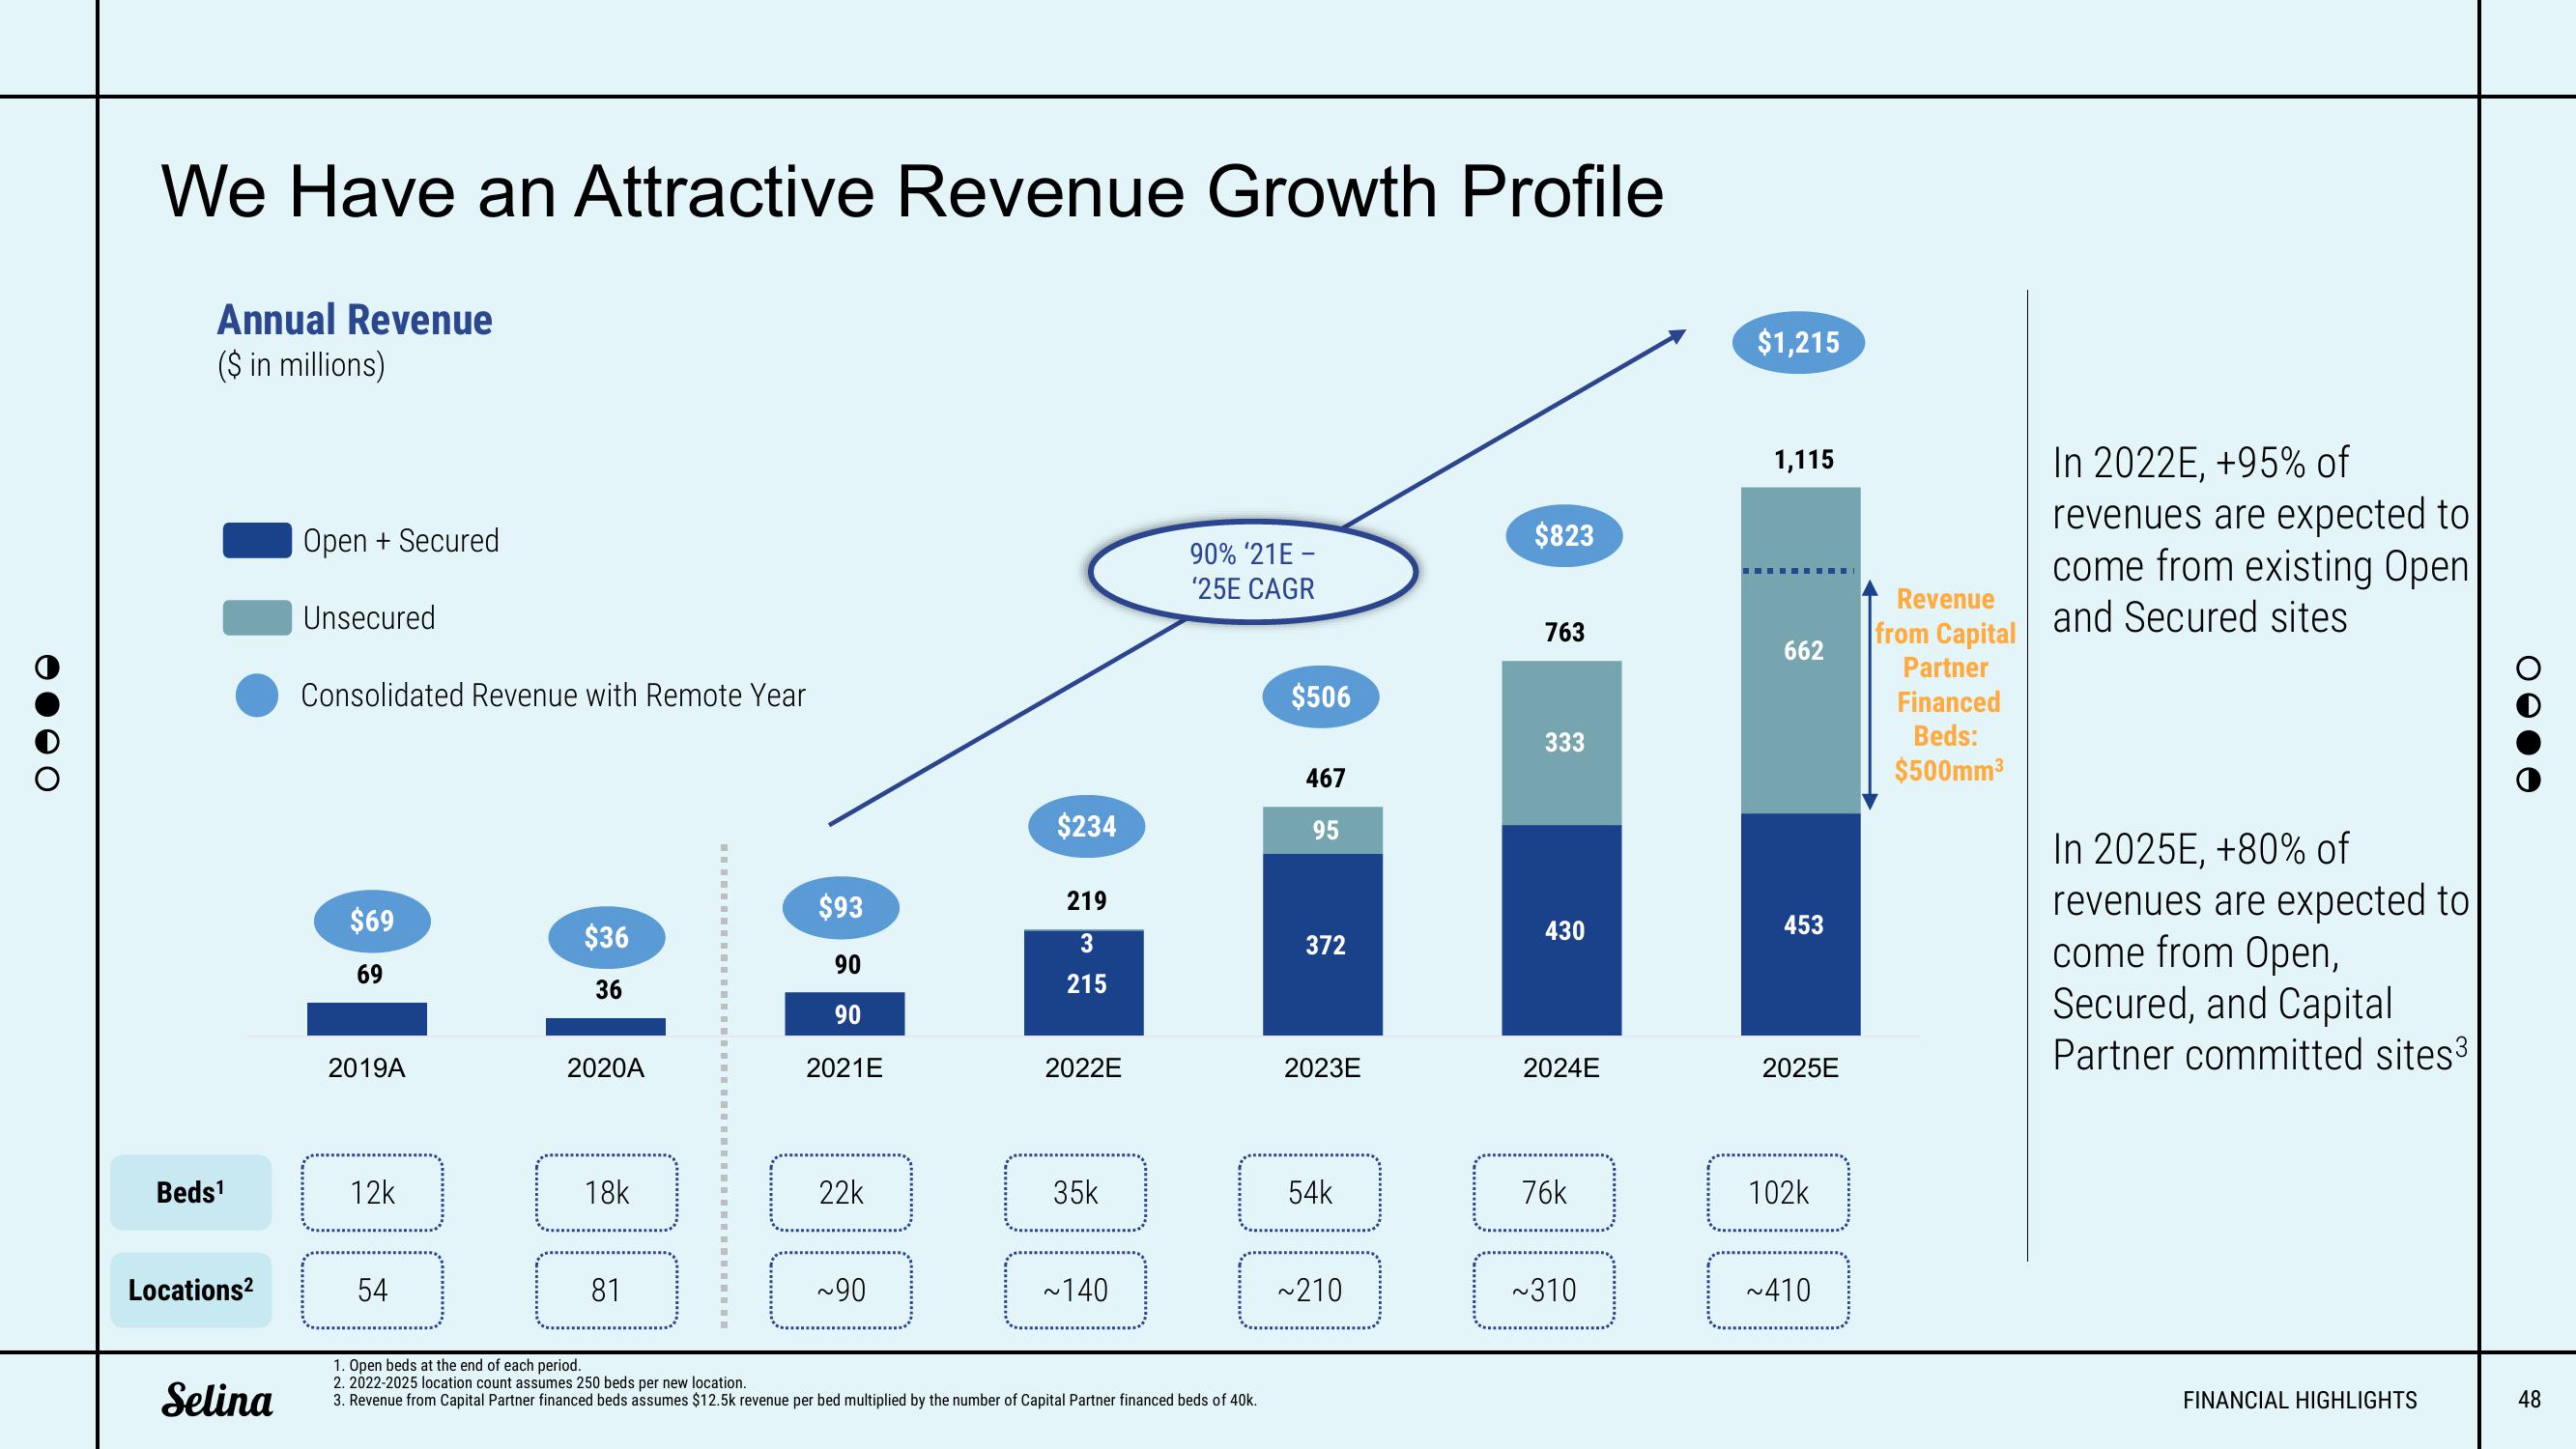
We Have an Attractive Revenue Growth Profile
Annual Revenue
($ in millions)
Beds¹
Locations²
Selina
Open + Secured
Unsecured
Consolidated Revenue with Remote Year
$69
69
2019A
12k
54
$36
36
2020A
18k
81
m
1
H
M
$93
90
90
2021E
22k
~90
$234
219
3
215
2022E
35k
~140
90% '21E -
'25E CAGR
1. Open beds at the end of each period.
2. 2022-2025 location count assumes 250 beds per new location.
3. Revenue from Capital Partner financed beds assumes $12.5k revenue per bed multiplied by the number of Capital Partner financed beds of 40k.
$506
467
95
372
2023E
54k
~210
$823
763
333
430
2024E
76k
~310
$1,215
1,115
‒‒‒‒‒
662
453
2025E
102k
~410
Revenue
from Capital
Partner
Financed
Beds:
$500mm³
In 2022E, +95% of
revenues are expected to
come from existing Open
and Secured sites
In 2025E, +80% of
revenues are expected to
come from Open,
Secured, and Capital
Partner committed sites³
FINANCIAL HIGHLIGHTS
48View entire presentation