Nareit’s REITworld 2023 Annual Conference
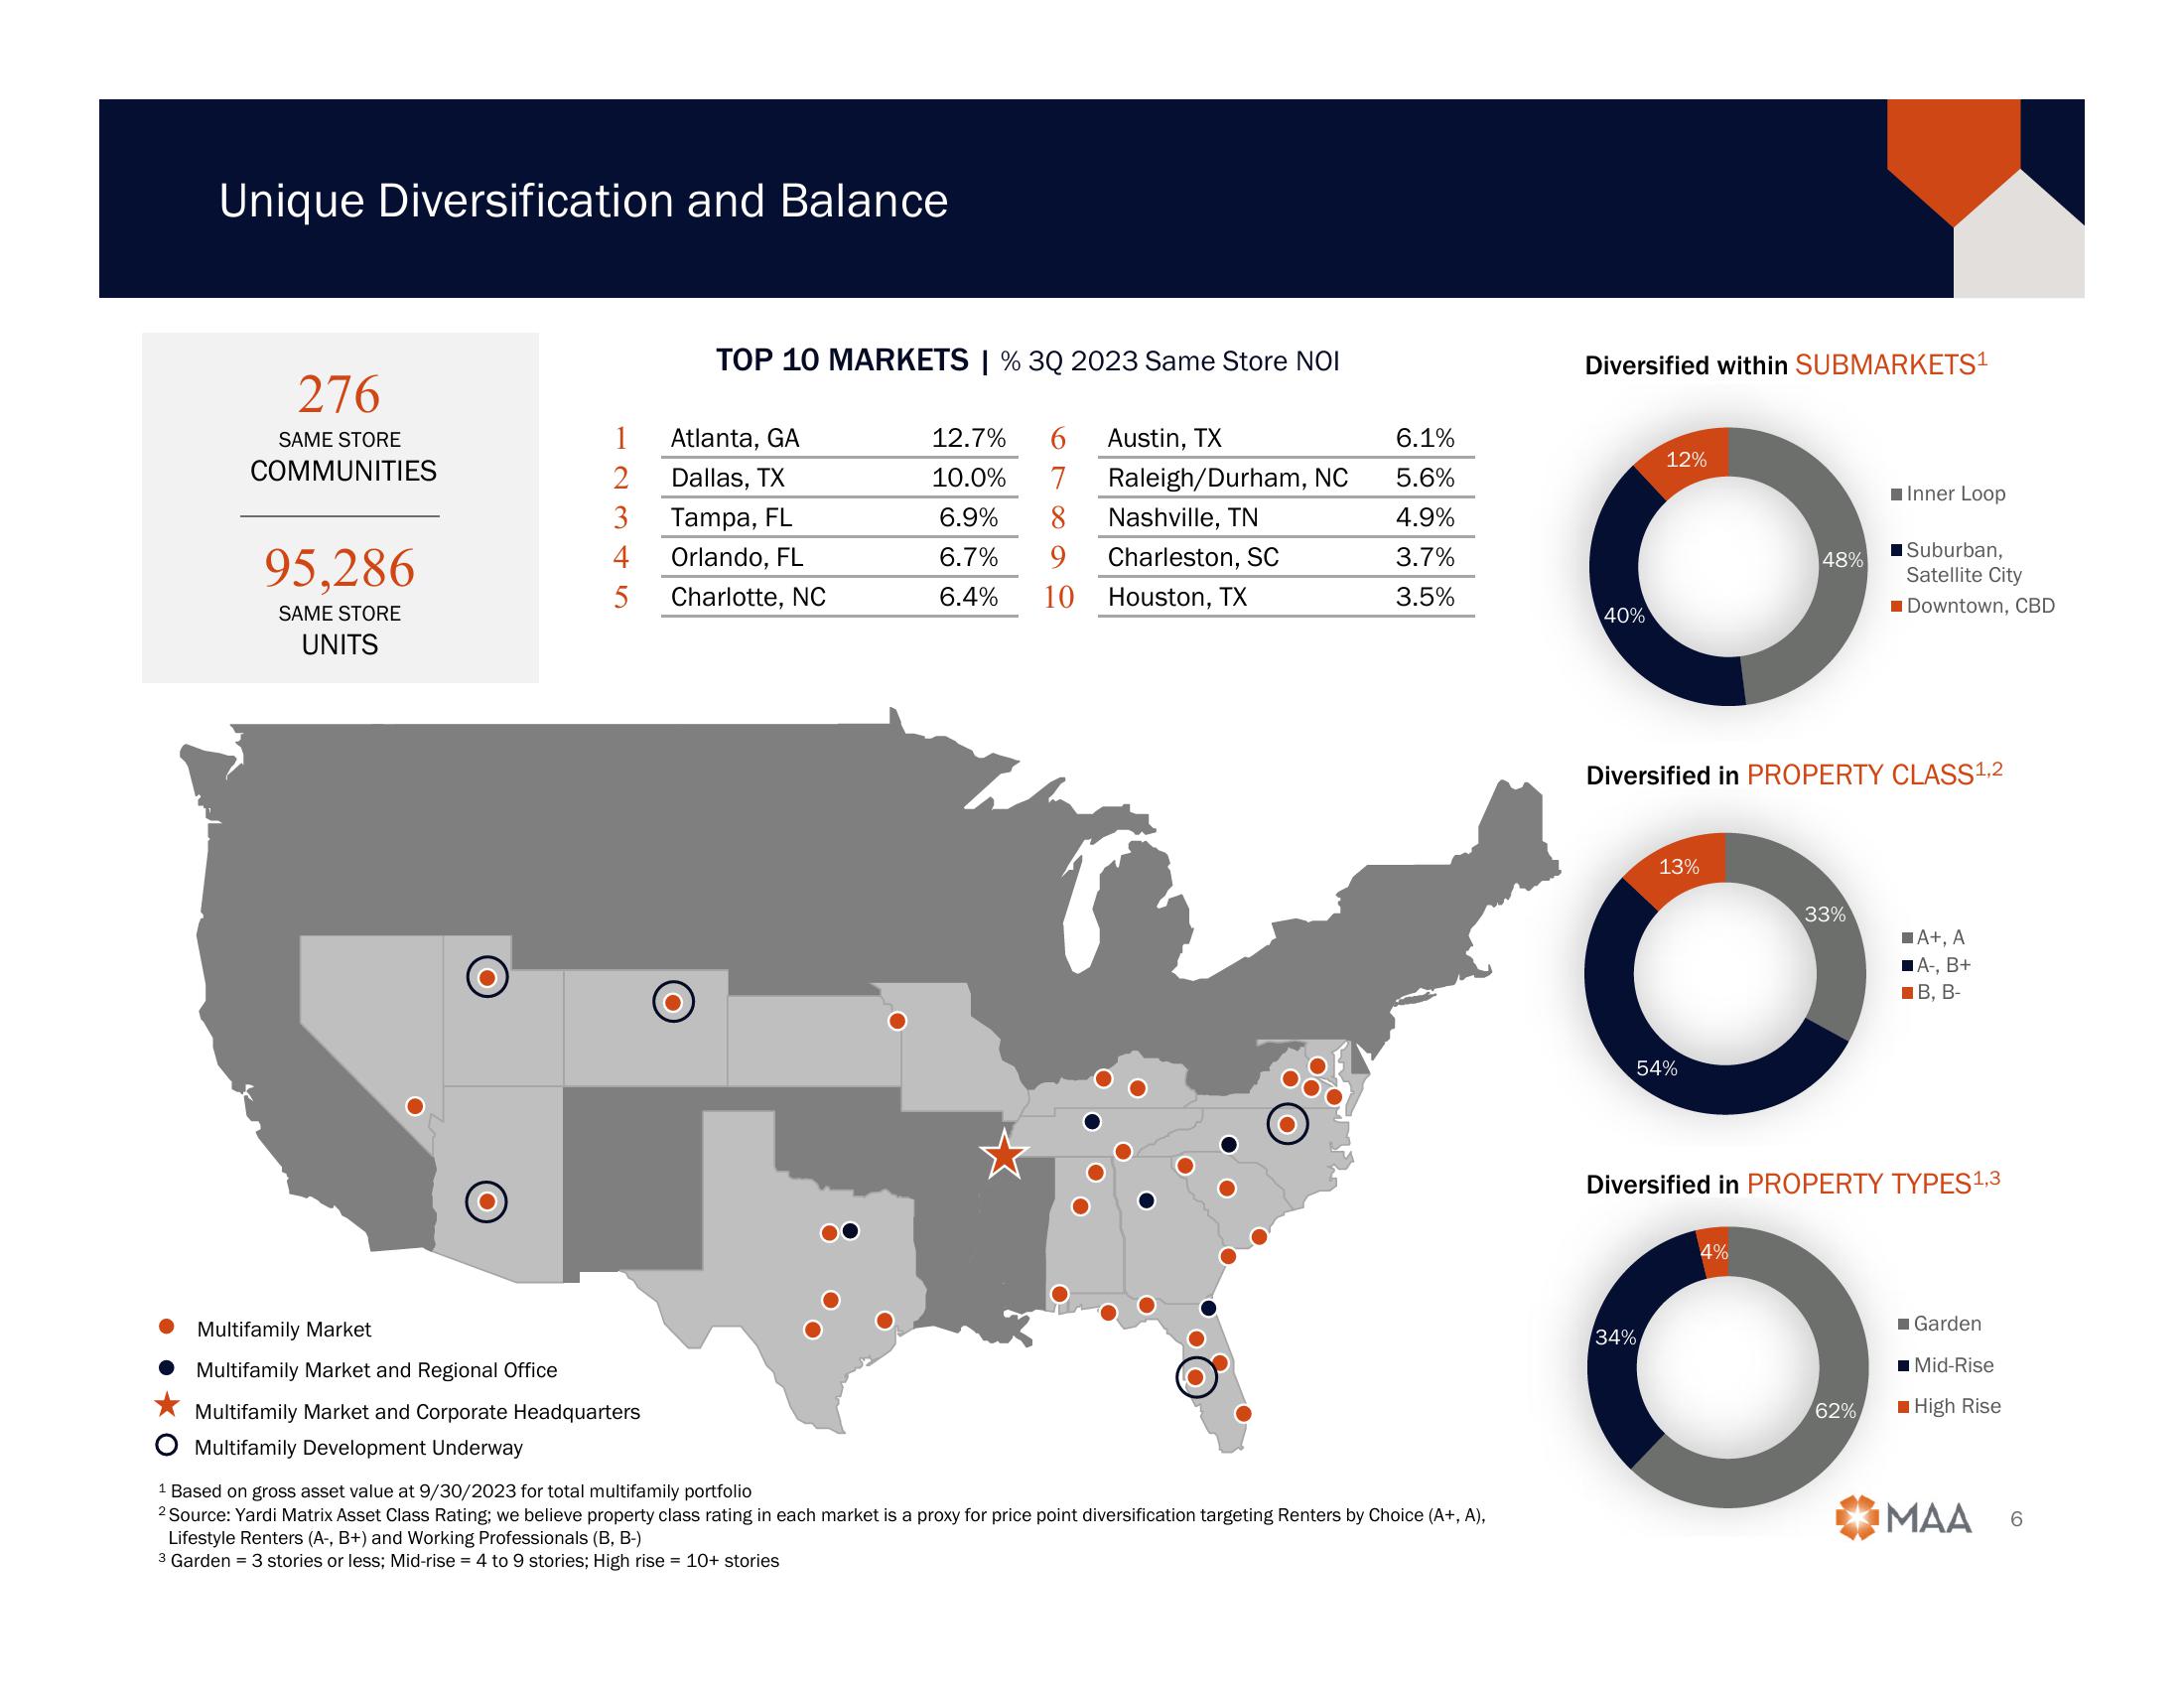
Unique Diversification and Balance
276
SAME STORE
COMMUNITIES
95,286
SAME STORE
UNITS
1
2
3
4
5
Multifamily Market
Multifamily Market and Regional Office
Multifamily Market and Corporate Headquarters
Multifamily Development Underway
TOP 10 MARKETS | % 3Q 2023 Same Store NOI
Atlanta, GA
Dallas, TX
Tampa, FL
12.7% 6 Austin, TX
10.0% 7 Raleigh/Durham, NC
6.9%
8 Nashville, TN
6.7% 9 Charleston, SC
6.4% 10
Orlando, FL
Charlotte, NC
Houston, TX
6.1%
5.6%
4.9%
3.7%
3.5%
1 Based on gross asset value at 9/30/2023 for total multifamily portfolio
2 Source: Yardi Matrix Asset Class Rating; we believe property class rating in each market is a proxy for price point diversification targeting Renters by Choice (A+, A),
Lifestyle Renters (A-, B+) and Working Professionals (B, B-)
3 Garden = 3 stories or less; Mid-rise = 4 to 9 stories; High rise = 10+ stories
Diversified within SUBMARKETS¹
40%
12%
48%
13%
33%
O
54%
■Inner Loop
■Suburban,
Diversified in PROPERTY CLASS¹,2
4%
34%
O
62%
Satellite City
Downtown, CBD
A+, A
■A-, B+
B, B-
Diversified in PROPERTY TYPES 1,3
■Garden
■Mid-Rise
High Rise
MAA 6View entire presentation