J.P.Morgan 2Q23 Investor Results
JPMORGAN CHASE & CO.
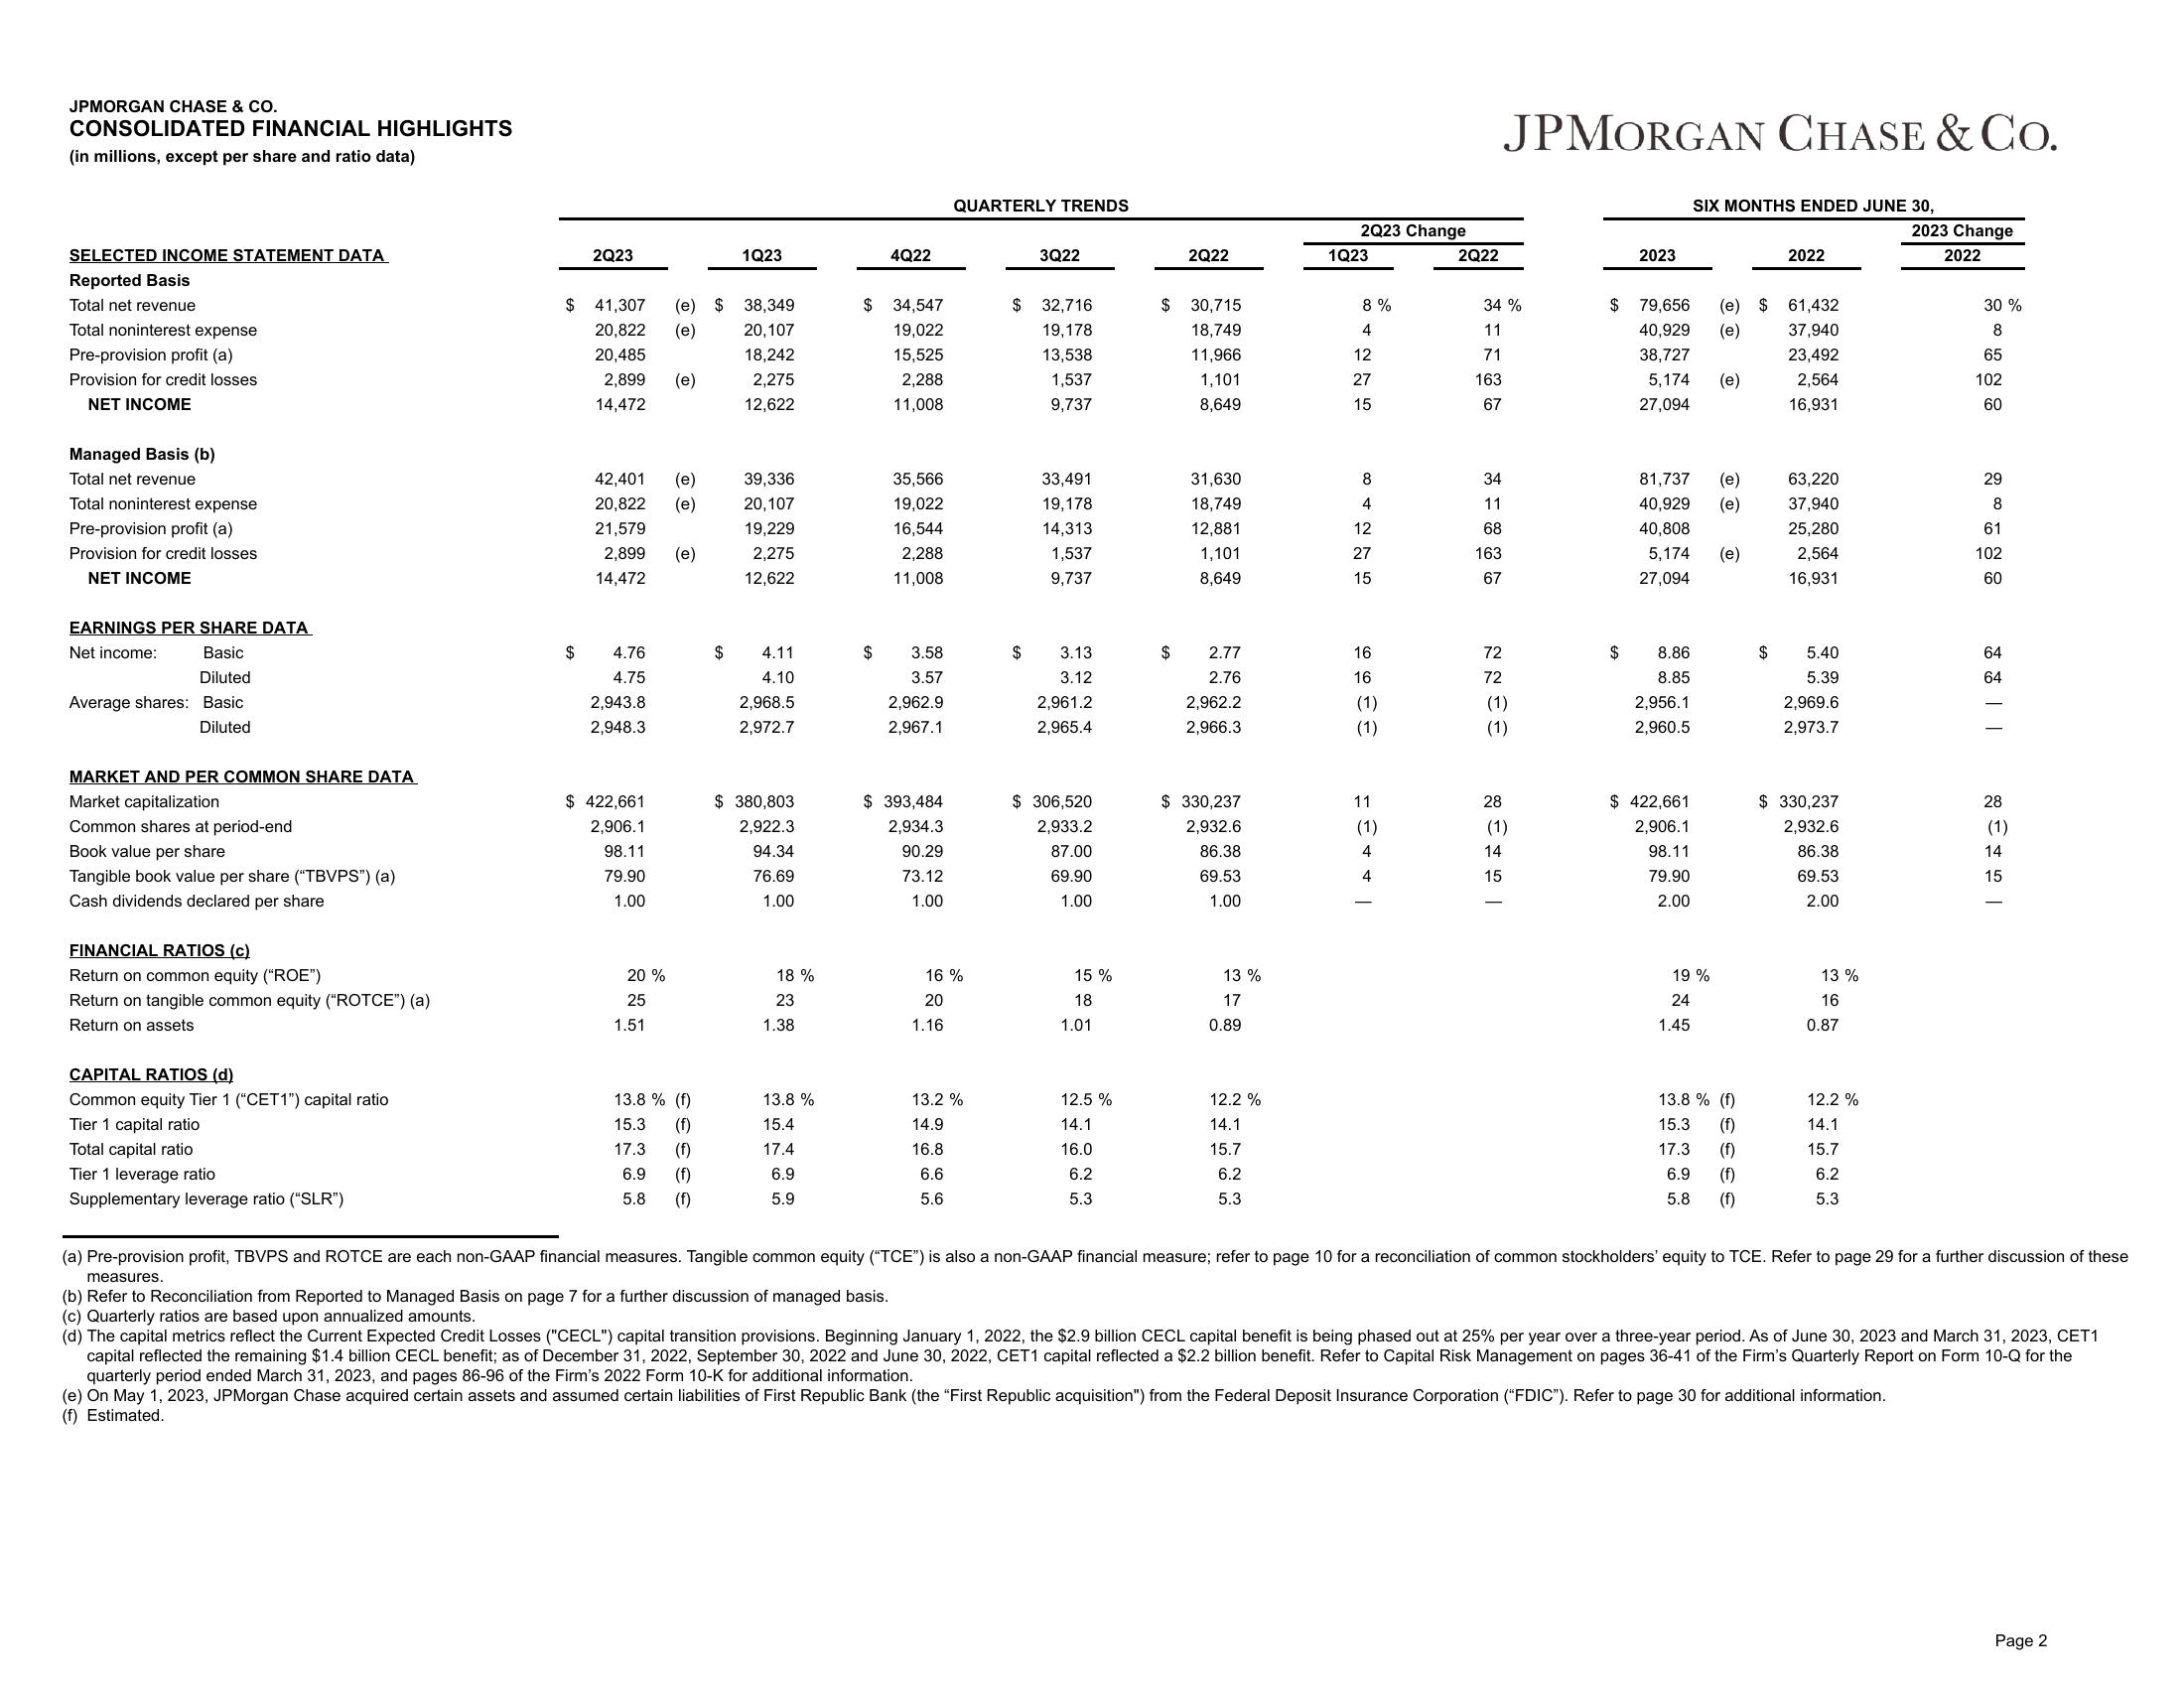
CONSOLIDATED FINANCIAL HIGHLIGHTS
(in millions, except per share and ratio data)
SELECTED INCOME STATEMENT DATA
Reported Basis
Total net revenue
Total noninterest expense
Pre-provision profit (a)
Provision for credit losses
NET INCOME
Managed Basis (b)
Total net revenue
Total noninterest expense
Pre-provision profit (a)
Provision for credit losses
NET INCOME
EARNINGS PER SHARE DATA
Net income:
Basic
Diluted
Average shares: Basic
Diluted
MARKET AND PER COMMON SHARE DATA
Market capitalization
Common shares at period-end
Book value per share
Tangible book value per share ("TBVPS") (a)
Cash dividends declared per share
FINANCIAL RATIOS (c)
Return on common equity ("ROE")
Return on tangible common equity ("ROTCE") (a)
Return on assets
CAPITAL RATIOS (d)
Common equity Tier 1 ("CET1") capital ratio
Tier 1 capital ratio
Total capital ratio
Tier 1 leverage ratio
Supplementary leverage ratio ("SLR")
$
$
2Q23
41,307
20,822
20,485
2,899 (e)
14,472
42,401 (e)
(e)
20,822
21,579
2,899 (e)
14,472
4.76
4.75
2,943.8
2,948.3
$ 422,661
2,906.1
98.11
79.90
1.00
20%
25
(e)
(e) $ 38,349
20,107
18,242
2,275
12,622
1.51
13.8% (f)
15.3
(f)
17.3
(f)
6.9
(f)
5.8 (f)
1Q23
$
39,336
20,107
19,229
2,275
12,622
4.11
4.10
2,968.5
2,972.7
$380,803
2,922.3
94.34
76.69
1.00
18 %
23
1.38
13.8%
15.4
17.4
6.9
5.9
$
$
4Q22
34,547
19,022
15,525
2,288
11,008
35,566
19,022
16,544
2,288
11,008
3.58
3.57
2,962.9
2,967.1
$393,484
2,934.3
90.29
73.12
1.00
QUARTERLY TRENDS
16 %
20
1.16
13.2 %
14.9
16.8
6.6
5.6
3Q22
$32,716
19,178
13,538
1,537
9,737
$
33,491
19,178
14,313
1,537
9,737
3.13
3.12
2,961.2
2,965.4
$ 306,520
2,933.2
87.00
69.90
1.00
15 %
18
1.01
12.5 %
14.1
16.0
6.2
5.3
2Q22
$ 30,715
18,749
11,966
1,101
8,649
$
31,630
18,749
12,881
1,101
8,649
2.77
2.76
2,962.2
2,966.3
$ 330,237
2,932.6
86.38
69.53
1.00
13 %
17
0.89
12.2 %
14.1
15.7
6.2
5.3
2Q23 Change
1Q23
8%
4
12
27
15
8
4
12
27
15
16
16
(1)
(1)
11
(1)
+ + 1
2Q22
34%
11
71
163
67
34
11
68
163
67
72
72
JPMORGAN CHASE & Co.
(1)
(1)
28
(1)
14
15
2023
$ 79,656
40,929
38,727
5,174
27,094
$
8.86
8.85
2,956.1
2,960.5
$ 422,661
2,906.1
SIX MONTHS ENDED JUNE 30,
81,737 (e)
40,929 (e)
40,808
5,174
27,094
98.11
79.90
2.00
19 %
24
1.45
(e) $ 61,432
(e)
37,940
23,492
(e)
(e)
13.8% (f)
15.3
(f)
17.3
(f)
6.9
(f)
5.8 (f)
2022
$
2,564
16,931
63,220
37,940
25,280
2,564
16,931
5.40
5.39
2,969.6
2,973.7
$ 330,237
2,932.6
86.38
69.53
2.00
13 %
16
0.87
12.2 %
14.1
15.7
6.2
5.3
2023 Change
2022
30 %
8
65
102
60
29
8
61
102
60
64
64
28
(1)
14
15
(a) Pre-provision profit, TBVPS and ROTCE are each non-GAAP financial measures. Tangible common equity ("TCE") is also a non-GAAP financial measure; refer to page 10 for a reconciliation of common stockholders' equity to TCE. Refer to page 29 for a further discussion of these
(b) Refer to Reconciliation from Reported to Managed Basis on page 7 for a further discussion of managed basis.
measures.
(c) Quarterly ratios are based upon annualized amounts.
(d) The capital metrics reflect the Current Expected Credit Losses ("CECL") capital transition provisions. Beginning January 1, 2022, the $2.9 billion CECL capital benefit is being phased out at 25% per year over a three-year period. As of June 30, 2023 and March 31, 2023, CET1
capital reflected the remaining $1.4 billion CECL benefit; as of December 31, 2022, September 30, 2022 and June 30, 2022, CET1 capital reflected a $2.2 billion benefit. Refer to Capital Risk Management on pages 36-41 of the Firm's Quarterly Report on Form 10-Q for the
quarterly period ended March 31, 2023, and pages 86-96 of the Firm's 2022 Form 10-K for additional information.
(e) On May 1, 2023, JPMorgan Chase acquired certain assets and assumed certain liabilities of First Republic Bank (the "First Republic acquisition") from the Federal Deposit Insurance Corporation ("FDIC"). Refer to page 30 for additional information.
(f) Estimated.
Page 2View entire presentation