BAT Results Presentation Deck
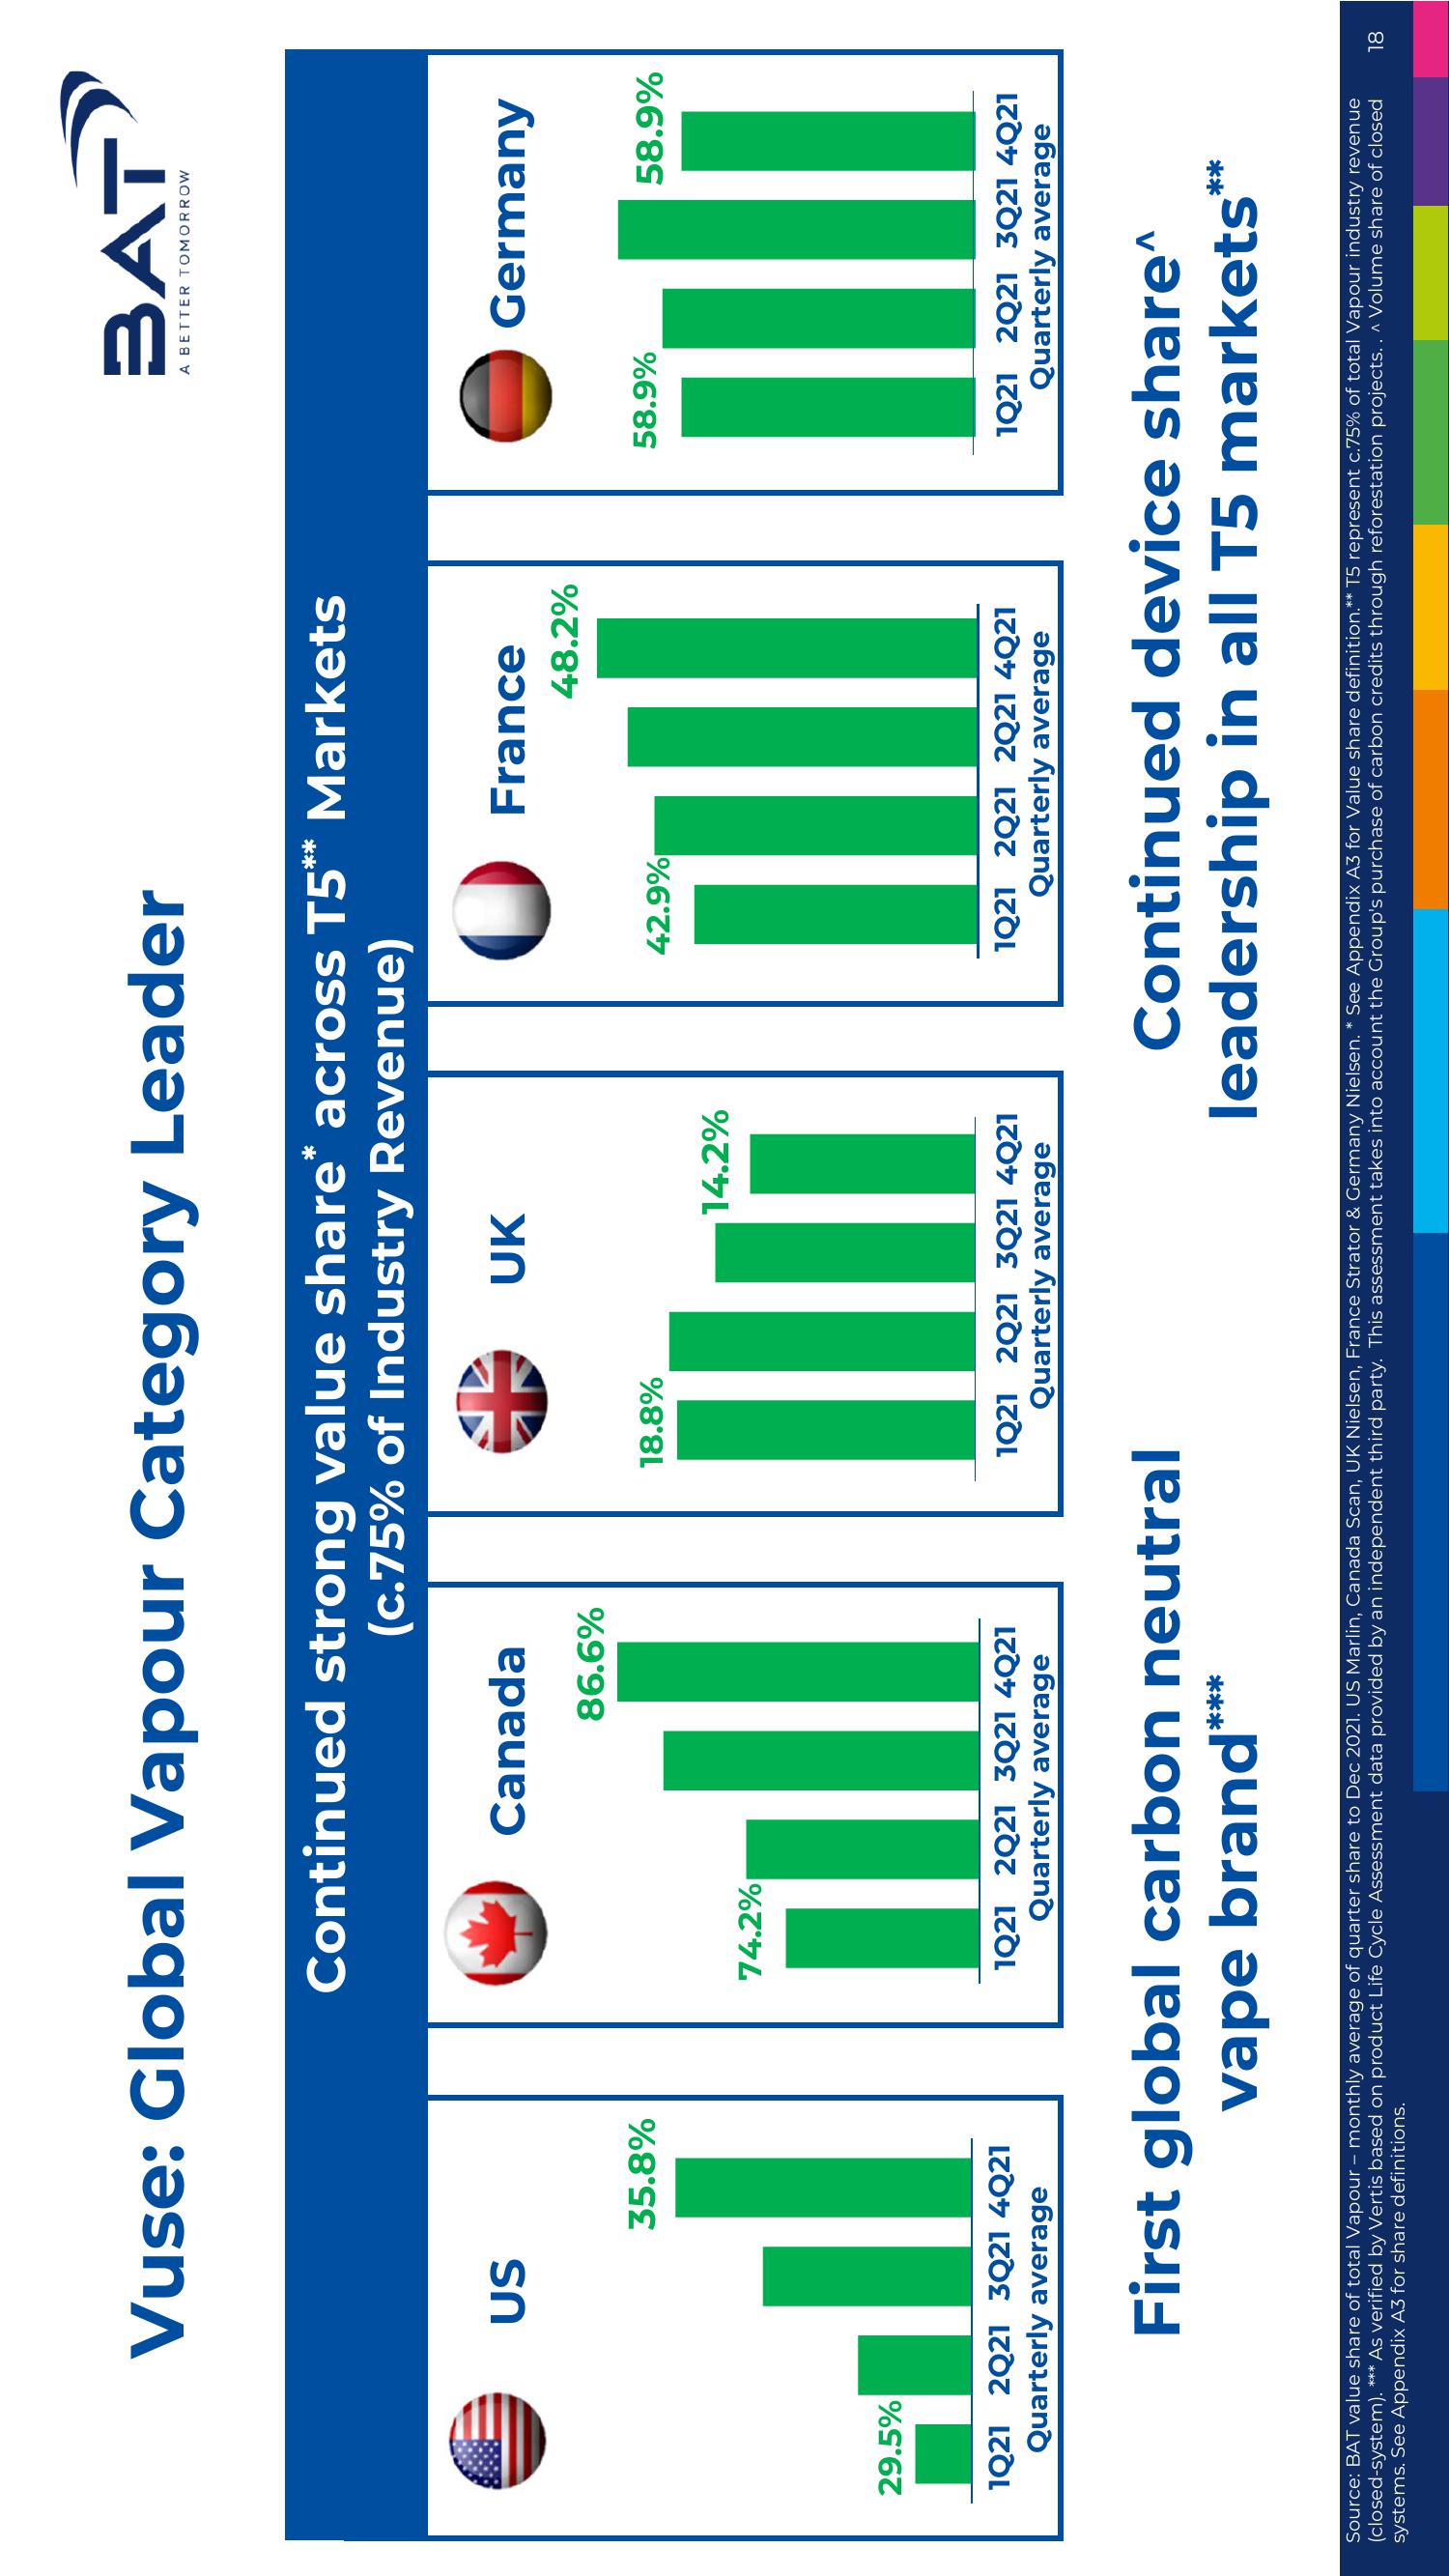
29.5%
Vuse: Global Vapour Category Leader
US
35.8%
1Q21 2Q21 3021 4Q21
Quarterly average
Continued strong value share* across T5** Markets
(c.75% of Industry Revenue)
74.2%
Canada
86.6%
1Q21 2Q21 3Q21 4Q21
Quarterly average
18.8%
UK
First global carbon neutral
vape brand***
14.2%
1Q21 2Q21 3021 4021
Quarterly average
42.9%
France
48.2%
1Q21 2021 2021 4Q21
Quarterly average
BAT
A BETTER TOMORROW
58.9%
Germany
58.9%
1021 2021 3021 4Q21
Quarterly average
Continued device share^
leadership in all T5 markets*
**
Source: BAT value share of total Vapour monthly average of quarter share to Dec 2021. US Marlin, Canada Scan, UK Nielsen, France Strator & Germany Nielsen. * See Appendix A3 for Value share definition.** T5 represent c.75% of total Vapour industry revenue
(closed-system). *** As verified by Vertis based on product Life Cycle Assessment data provided by an independent third party. This assessment takes into account the Group's purchase of carbon credits through reforestation projects. . ^ Volume share of closed 18
systems. See Appendix A3 for share definitions.View entire presentation