Baird Investment Banking Pitch Book
4 SELECTED MERGER CONSEQUENCES SUMMARY
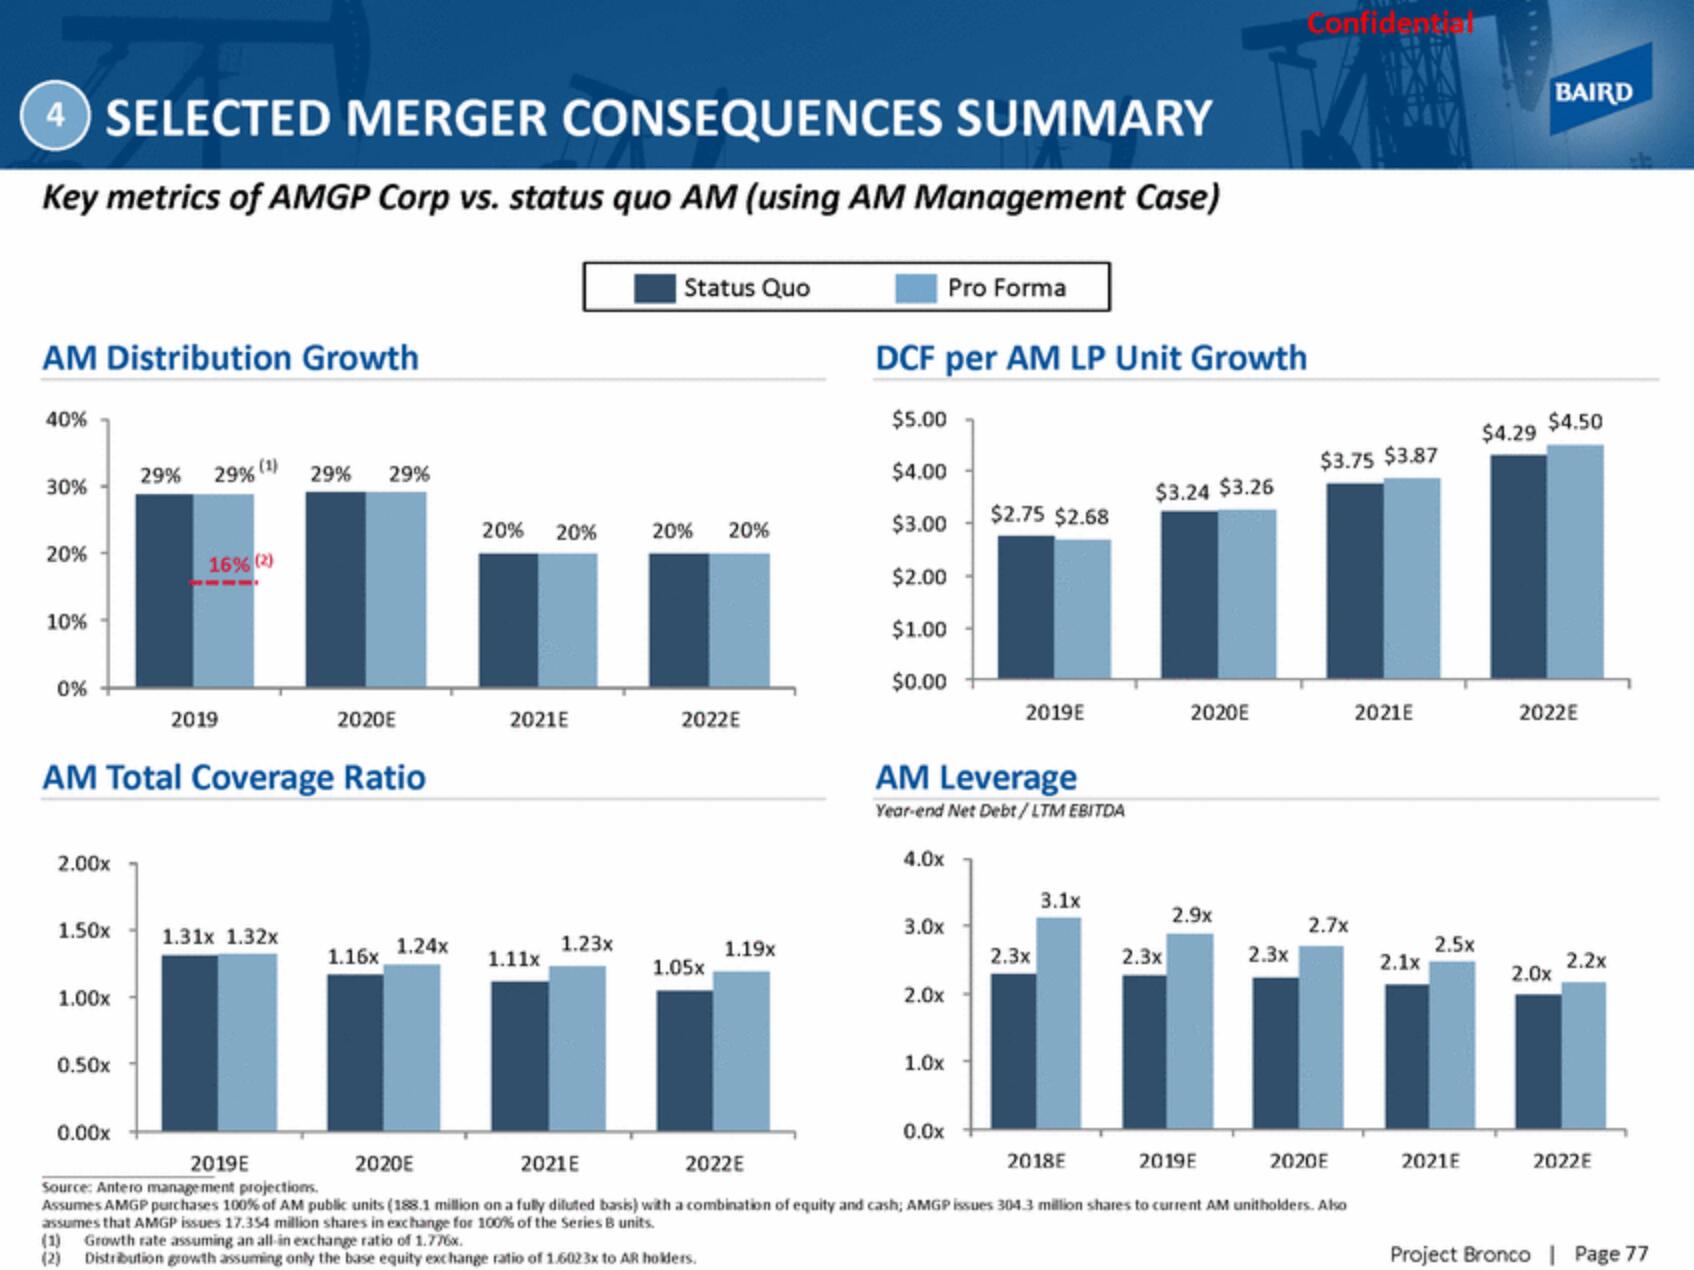
Key metrics of AMGP Corp vs. status quo AM (using AM Management Case)
AM Distribution Growth
40%
30%
20%
10%
0%
2.00x
1.50x
1.00x
0.50x
29%
0.00x
29% (1)
AM Total Coverage Ratio
16% (2)
2019
29% 29%
1.31x 1.32x
2020E
1.16x
1.24x
20% 20%
2021E
1.11x
1.23x
Status Quo
20% 20%
2022E
1.05x
1.19x
Pro Forma
DCF per AM LP Unit Growth
$5.00
$4.00
$3.00
$2.00
$1.00
$0.00
4.0x
AM Leverage
Year-end Net Debt/LTM EBITDA
3.0x
2.0x
1.0x
$2.75 $2.68
0.0x
2019E
2.3x
3.1x
$3.24 $3.26
2018E
2.3x
2020E
2.9x
2.3x
Confidential
$3.75 $3.87
2.7x
2019E
2020E
2021E
2022E
2019E
Source: Antero management projections.
Assumes AMGP purchases 100% of AM public units (188.1 million on a fully diluted basis) with a combination of equity and cash; AMGP issues 304.3 million shares to current AM unitholders. Also
assumes that AMGP issues 17.354 million shares in exchange for 100% of the Series B units.
(1) Growth rate assuming an all-in exchange ratio of 1.776x.
(2)
Distribution growth assuming only the base equity exchange ratio of 1.6023x to AR holders.
2020E
2021E
2.1x
2.5x
2021E
$4.29
BAIRD
$4.50
2022E
2.0x
2.2x
2022E
Project Bronco | Page 77View entire presentation