Nikola SPAC Presentation Deck
NORTH AMERICA
FINANCIAL OVERVIEW
NORTH AMERICA FINANCIAL SUMMARY
SM, UNLESS OTHERWISE NOTED
BEV Trucks Sold (# of Units)
FCEV Trucks Sold (# of Units)
H2 Stations Completed (# of Units)
BEV Truck Revenue
FCEV Truck Revenue
FCEV Service & Maintenance Revenue
FCEV Hydrogen Revenue
Total Revenue
% Growth
(-) Cost of Goods Sold
Gross Profit
Gross Profit Margin
(-) Operating Expenses
EBIT
EBIT Margin
(+) Depreciation & Amortization
EBITDA
EBITDA Margin
Net Working Capital
% of Revenue
Truck Manufacturing Facility, Equipment & Other Capex
H2 Stations & Equipment Capex
Total Capital Expenditures
% of Revenue
.
2020P
Key Income Statement Drivers
Income Statement Items
nm
nm
(222)
(222)
nm
11
($211)
Financial projections below only cover North
America business and do not reflect potential
upside from 50/50 JV in Europe
($9)
nm
(156)
2021P
($156)
nm
600
:
$150
150
nm
20
($245)
(163.3%)
Balance Sheet and Cash Flow Items
(112)
38
25.2%
(303)
(265)
(176.9%)
$20
13.4%
(293)
(6)
($298)
198.7%
2022P
1,200
:
$300
300
100.0%
(242)
58
19.2%
(274)
(216)
(72.0%)
41
($175)
(58.4%)
$41
13.8%
(196)
(100)
($296)
98.6%
2023P
3,500
2,000
10
$875
470
13
56
1,414
371.4%
(1.113)
301
21.3%
(416)
(114)
(8.1%)
48
($66)
(4.6%)
$201
14.2%
(64)
(305)
($368)
26.0%
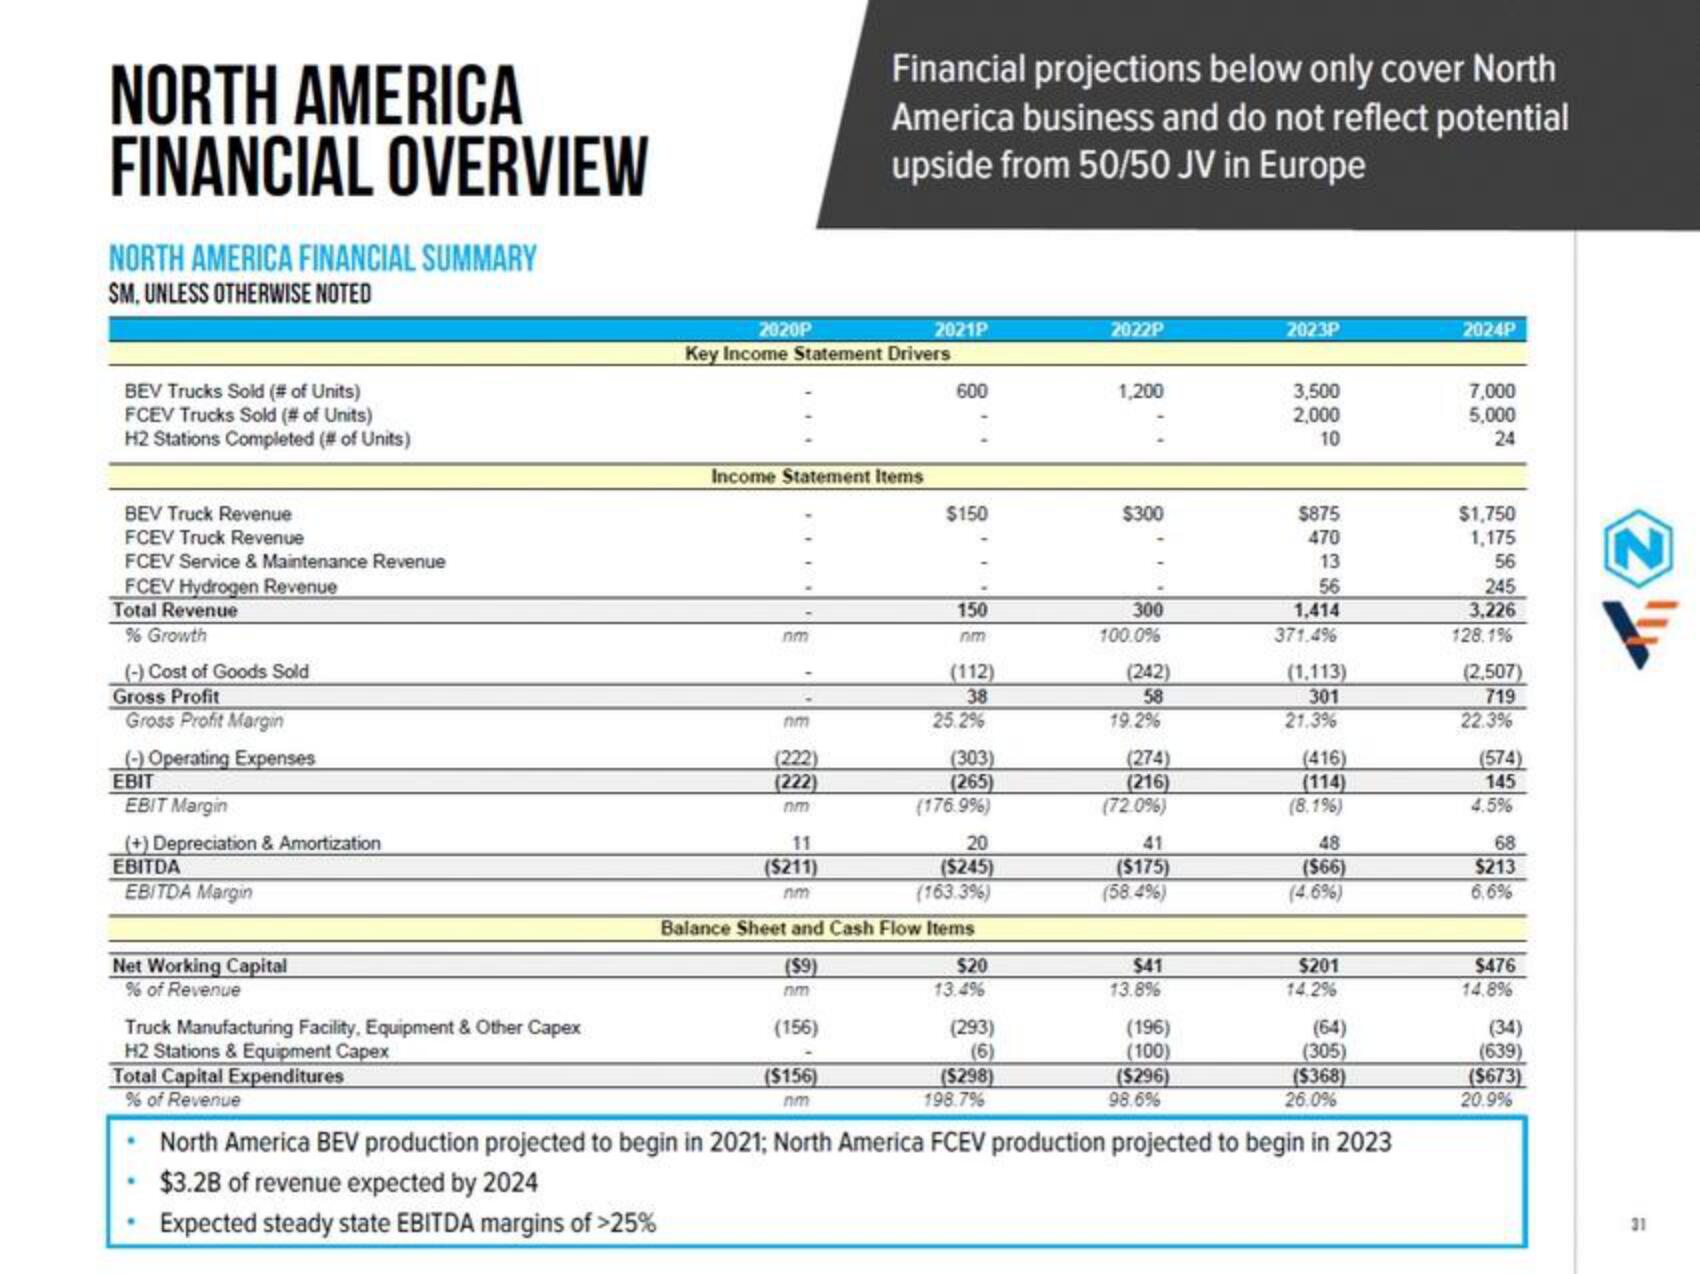
North America BEV production projected to begin in 2021; North America FCEV production projected to begin in 2023
$3.2B of revenue expected by 2024
Expected steady state EBITDA margins of >25%
2024P
7,000
5,000
24
$1,750
1,175
56
245
3,226
128.1%
(2.507)
719
22.3%
(574)
145
4.5%
68
$213
6,6%
$476
14.8%
(34)
(639)
($673)
20.9%
31View entire presentation