zSpace SPAC
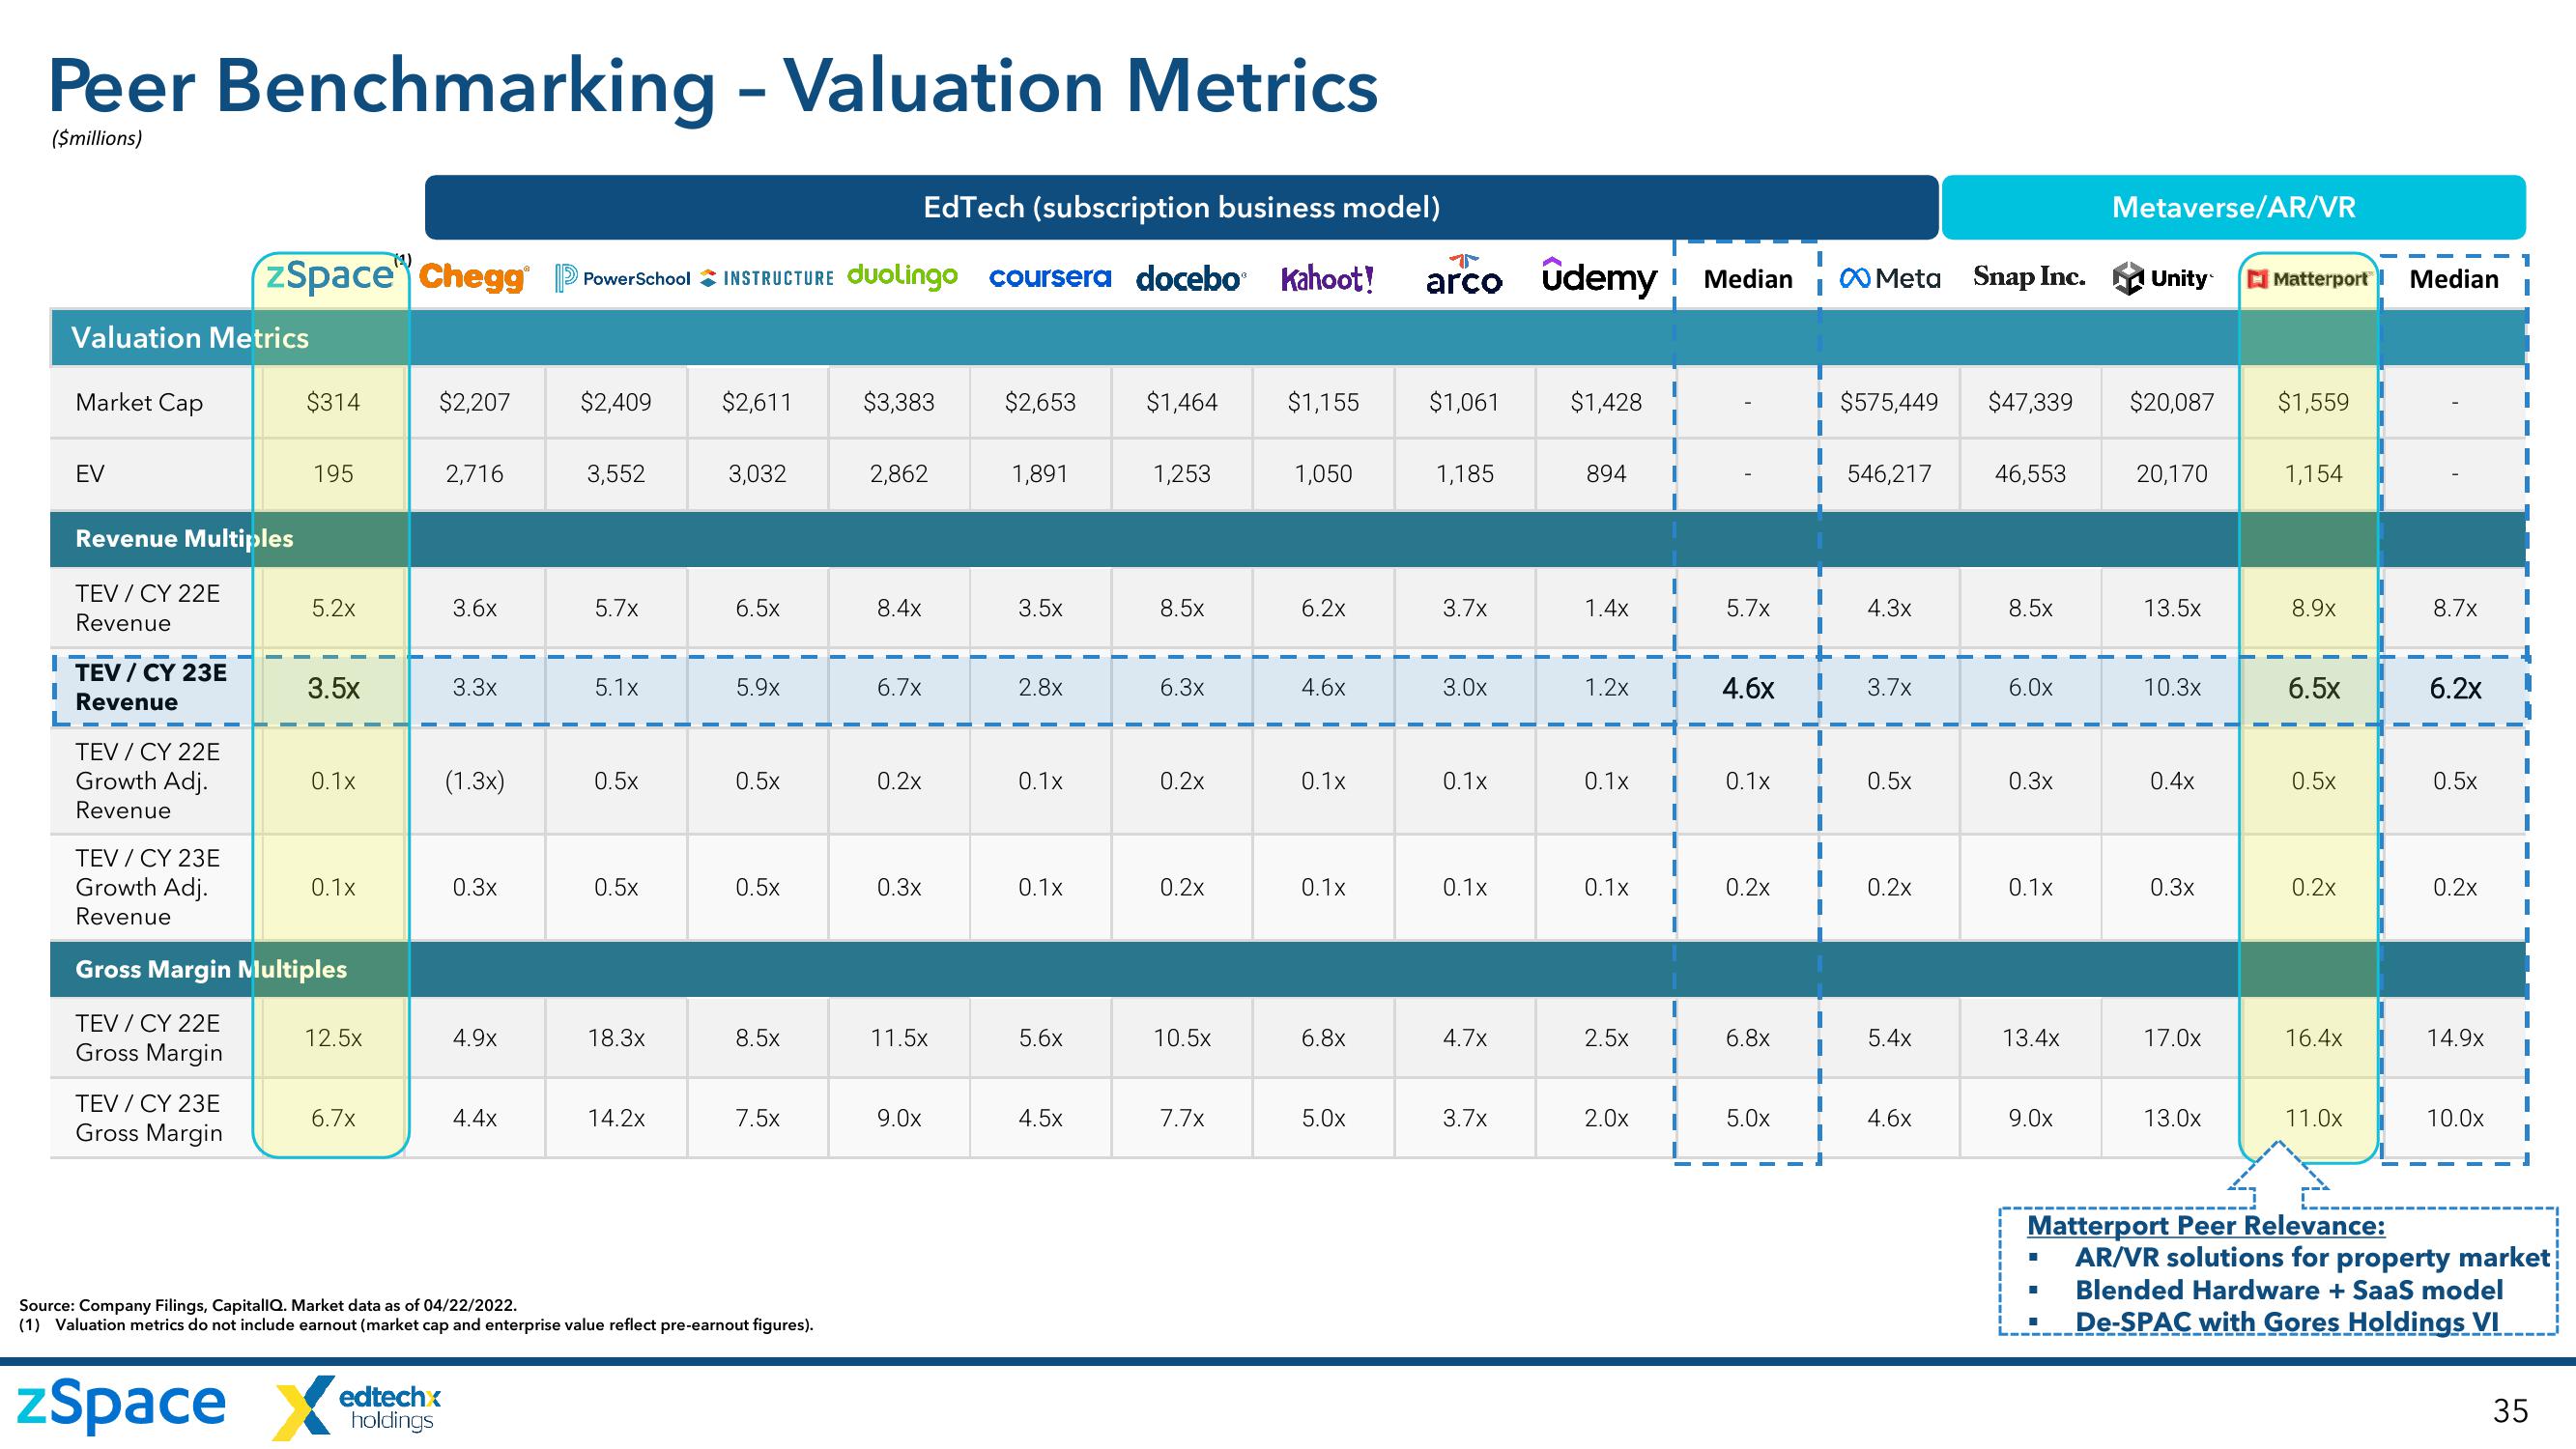
Peer Benchmarking - Valuation Metrics
($millions)
Valuation Metrics
Market Cap
EV
Revenue Multiples
TEV/CY 22E
Revenue
TEV/CY 23E
Revenue
TEV/CY 22E
Growth Adj.
Revenue
EdTech (subscription business model)
zSpace Chegg PowerSchool INSTRUCTURE duolingo coursera docebo Kahoot!
TEV/CY 23E
Growth Adj.
Revenue
TEV/CY 23E
Gross Margin
$314
195
5.2x
3.5x
0.1x
0.1x
Gross Margin Multiples
TEV/CY 22E
Gross Margin
12.5×
6.7x
$2,207
zSpace X
2,716
edtechx
holdings
3.6x
3.3x
(1.3x)
0.3x
4.9x
4.4x
$2,409
3,552
5.7x
5.1x
0.5x
0.5x
18.3x
14.2x
$2,611
3,032
6.5x
5.9x
0.5x
0.5x
8.5x
7.5x
Source: Company Filings, CapitallQ. Market data as of 04/22/2022.
(1) Valuation metrics do not include earnout (market cap and enterprise value reflect pre-earnout figures).
I
$3,383
2,862
8.4x
6.7x
0.2x
0.3x
11.5x
9.0x
$2,653
1,891
3.5x
2.8x
0.1x
0.1x
5.6x
4.5x
$1,464
1,253
8.5x
6.3x
0.2x
0.2x
10.5×
7.7x
$1,155
1,050
6.2x
4.6x
0.1x
0.1x
6.8x
5.0x
arco ûdemy Median
$1,061
1,185
3.7x
3.0x
0.1x
0.1x
4.7x
3.7x
$1,428
894
1.4x
1.2x
0.1x
0.1x
2.5x
2.0x
5.7x
4.6x
0.1x
0.2x
6.8x
5.0x
Meta Snap Inc.
I $575,449 $47,339
546,217 46,553
4.3x
3.7x
0.5x
0.2x
5.4x
4.6x
8.5x
6.0x
0.3x
0.1x
13.4x
9.0x
Metaverse/AR/VR
Unity
$20,087
20,170
13.5×
10.3x
0.4x
0.3x
17.0x
13.0x
Matterport Median
$1,559
1,154
8.9x
6.5x
0.5x
0.2x
16.4x
11.0x
8.7x
6.2x
0.5x
0.2x
14.9x
10.0x
Matterport Peer Relevance:
AR/VR solutions for property market
■ Blended Hardware + SaaS model
De-SPAC with Gores Holdings VI
35View entire presentation