OpenText Investor Presentation Deck
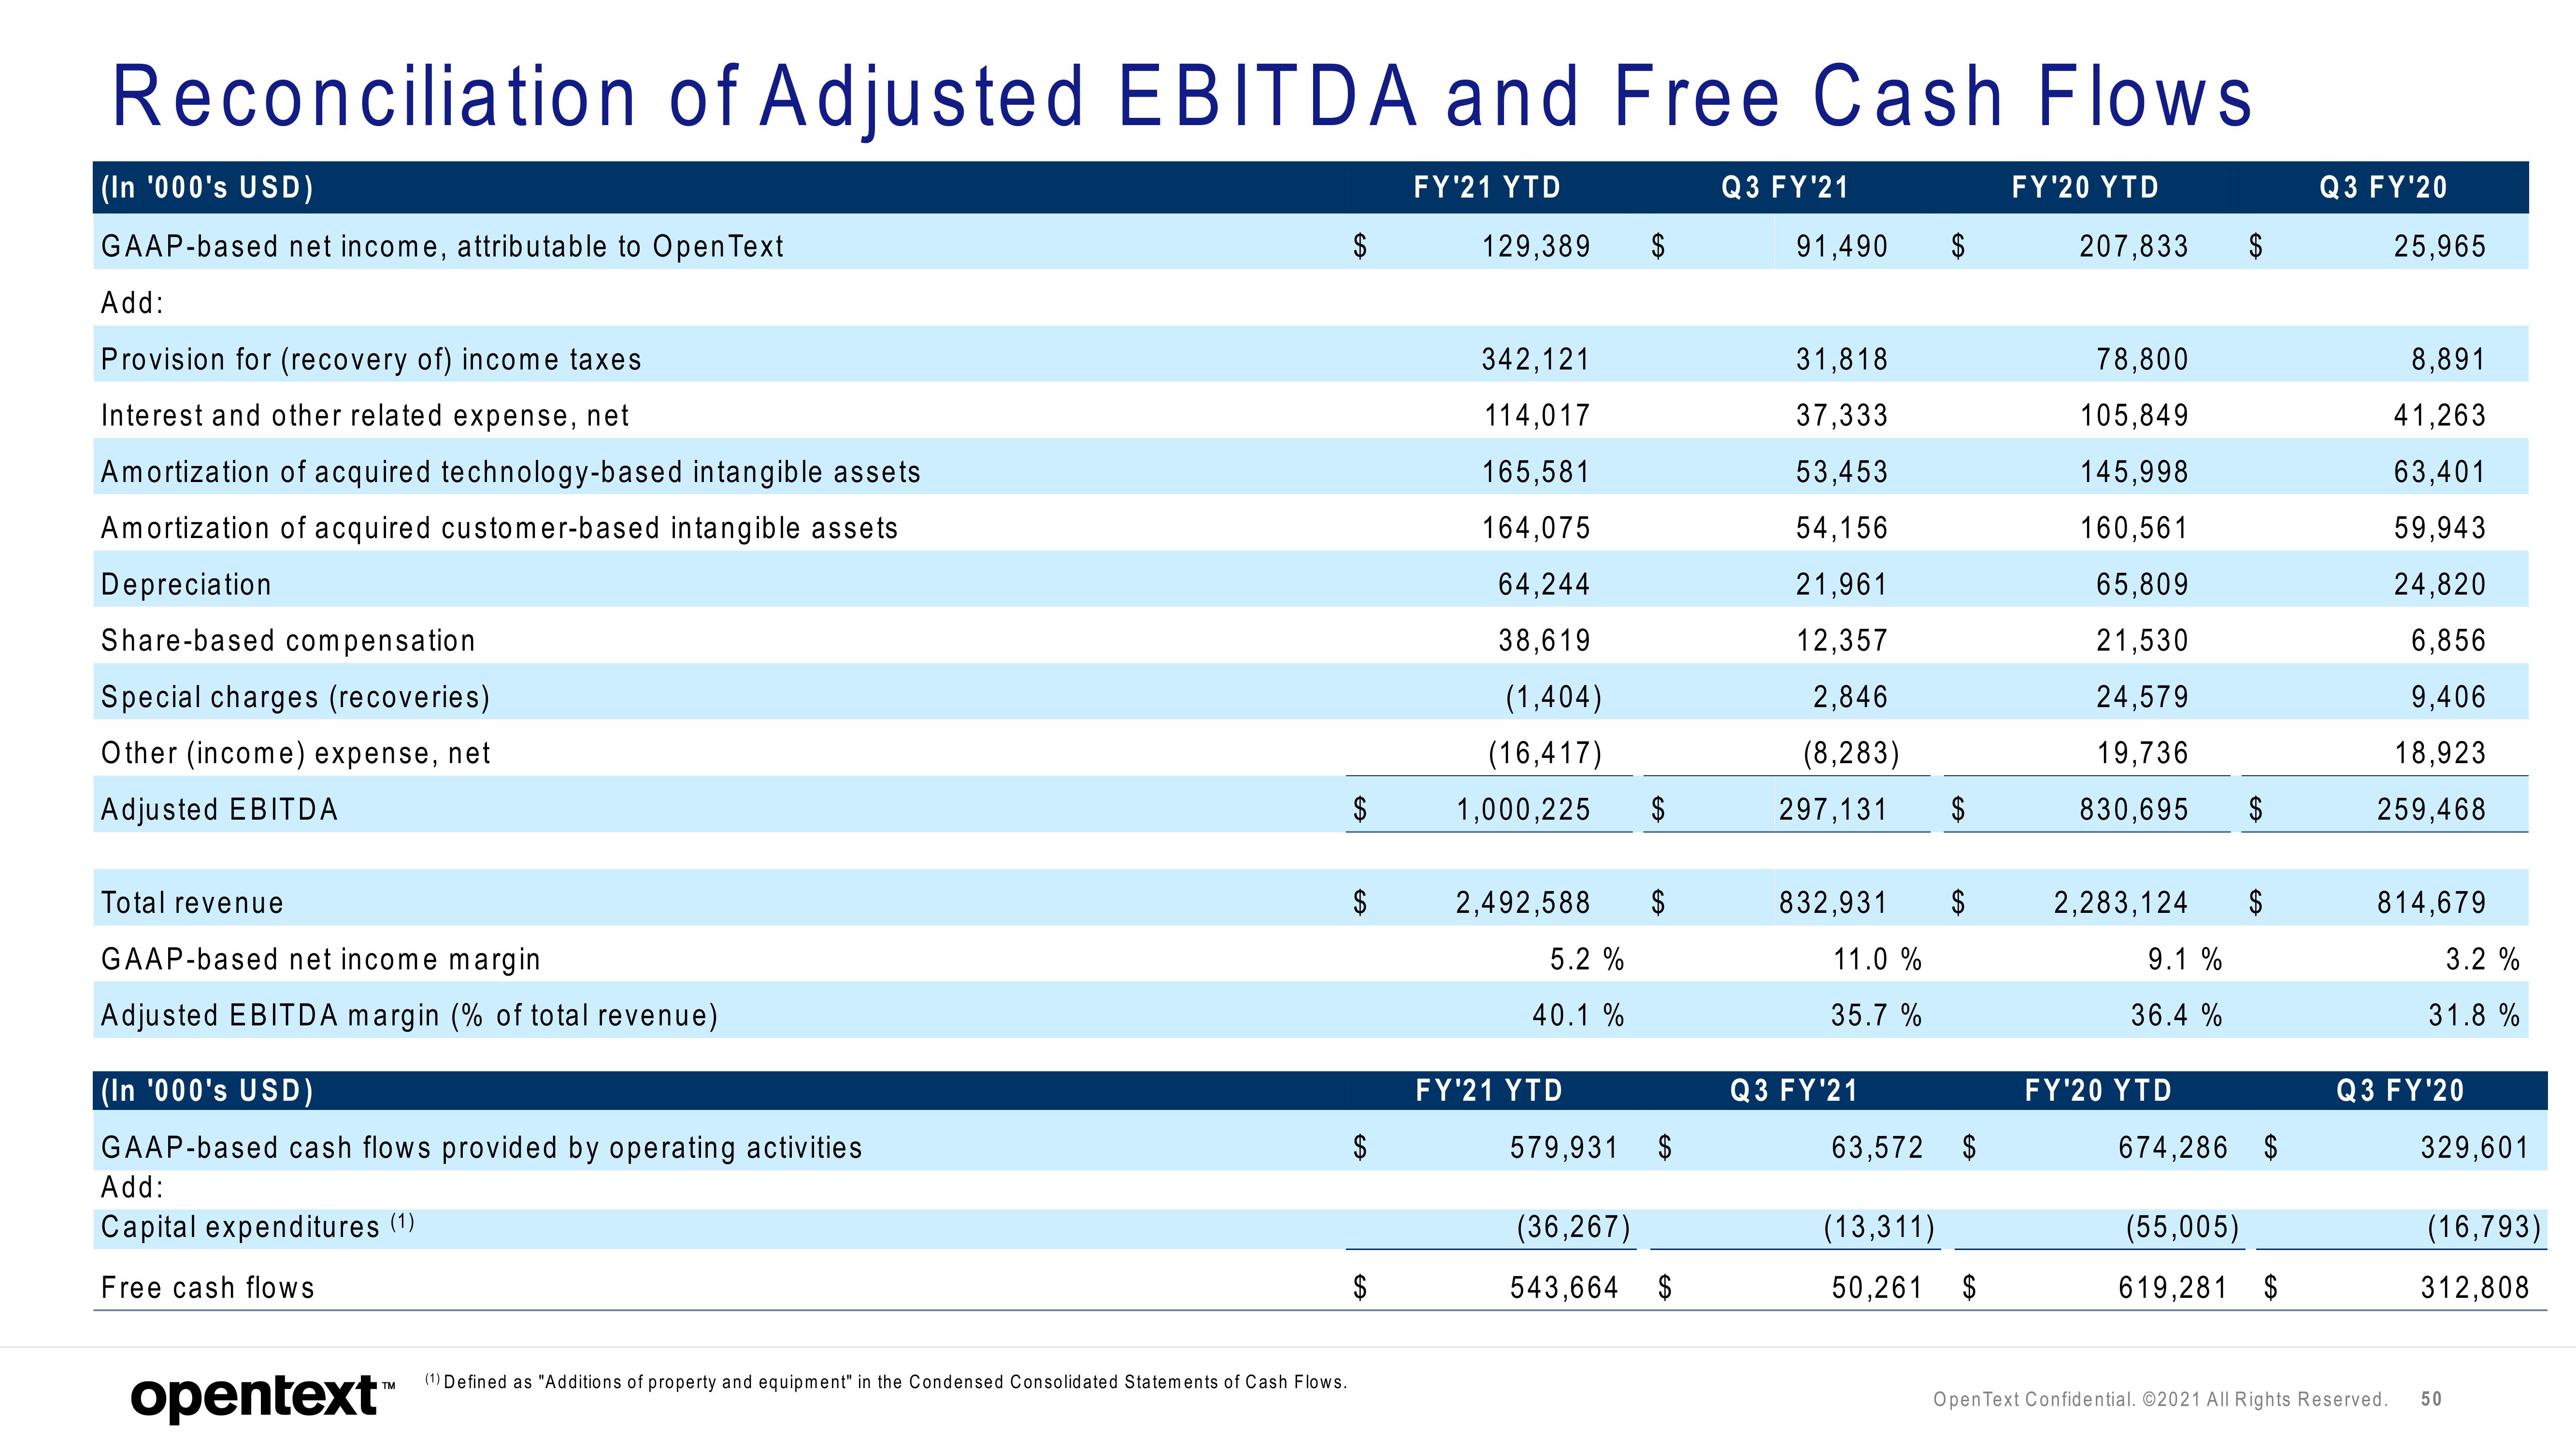
Reconciliation of Adjusted EBITDA and Free Cash Flows
FY'21 YTD
Q3 FY'21
FY'20 YTD
(In '000's USD)
GAAP-based net income, attributable to Open Text
Add:
Provision for (recovery of) income taxes
Interest and other related expense, net
Amortization of acquired technology-based intangible assets
Amortization of acquired customer-based intangible assets
Depreciation
Share-based compensation
Special charges (recoveries)
Other (income) expense, net
Adjusted EBITDA
Total revenue
GAAP-based net income margin
Adjusted EBITDA margin (% of total revenue)
(In '000's USD)
GAAP-based cash flows provided by operating activities
Add:
Capital expenditures (1)
Free cash flows
opentext™
(1) Defined as "Additions of property and equipment" in the Condensed Consolidated Statements of Cash Flows.
$
$
$
$
129,389 $
342,121
114,017
165,581
164,075
64,244
38,619
(1,404)
(16,417)
1,000,225
2,492,588
5.2 %
40.1 %
FY'21 YTD
579,931
$
$
(36,267)
543,664 $
91,490 $
31,818
37,333
53,453
54,156
21,961
12,357
2,846
(8,283)
297,131
832,931 $
11.0 %
35.7%
Q3 FY'21
63,572
$
(13,311)
50,261
$
$
207,833
78,800
105,849
145,998
160,561
65,809
21,530
24,579
19,736
830,695
2,283,124
9.1 %
36.4 %
FY'20 YTD
$
$
$
674,286 $
(55,005)
619,281 $
Q3 FY'20
25,965
8,891
41,263
63,401
59,943
24,820
6,856
9,406
18,923
259,468
814,679
3.2%
31.8%
Q3 FY'20
329,601
(16,793)
312,808
Open Text Confidential. ©2021 All Rights Reserved. 50View entire presentation