AstraZeneca Investor Day Presentation Deck
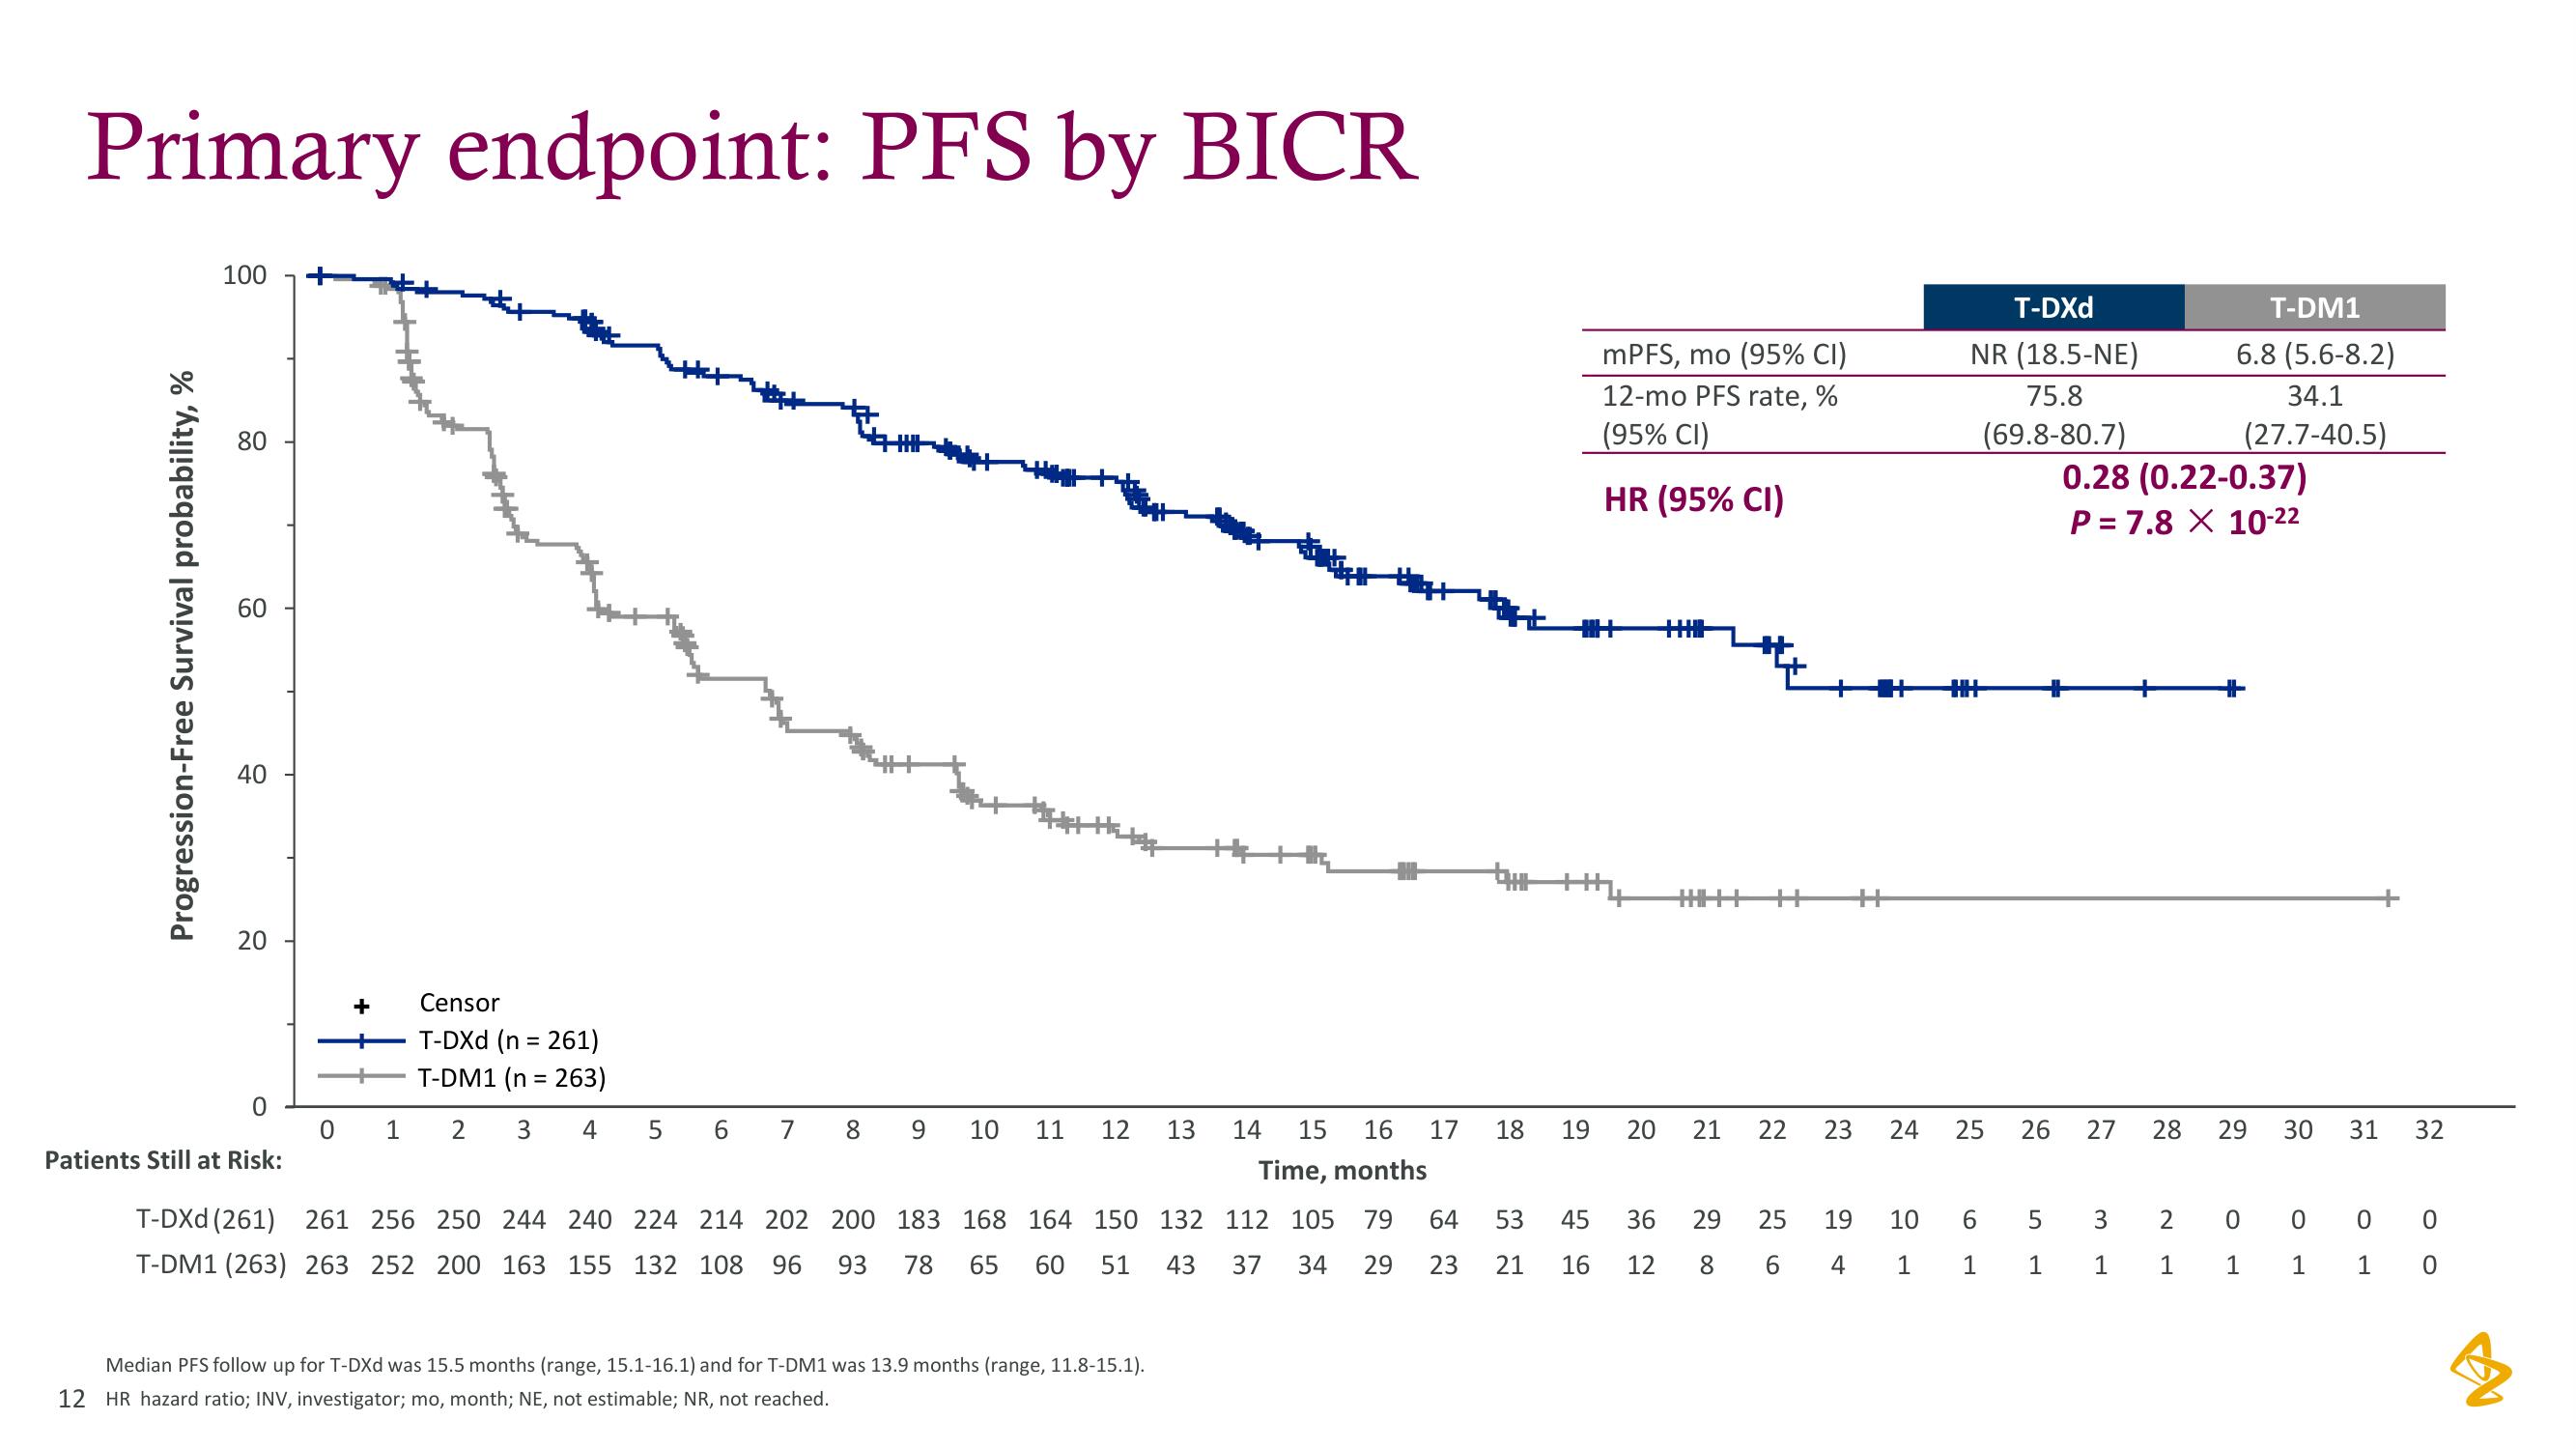
Primary endpoint: PFS by BICR
Progression-Free Survival probability, %
100
80
60
40
20
0
Patients Still at Risk:
0
Censor
+T-DXd (n = 261)
T-DM1 (n = 263)
+
1 2 3
4 5 6 7
8 9
10 11 12 13
14 15 16 17
Time, months
T-DXd (261) 261 256 250 244 240 224 214 202 200 183 168 164 150 132 112 105 79 64
T-DM1 (263) 263 252 200 163 155 132 108 96 93 78 65 60 51
43 37 34 29 23
Median PFS follow up for T-DXd was 15.5 months (range, 15.1-16.1) and for T-DM1 was 13.9 months (range, 11.8-15.1).
12 HR hazard ratio; INV, investigator; mo, month; NE, not estimable; NR, not reached.
THI
18 19
53
21
mPFS, mo (95% CI)
12-mo PFS rate, %
(95% CI)
HR (95% CI)
|||||
HHHHHH
20 21
45 36 29
12 8
16
∞
22
25
6
++
19
4
T-DXd
NR (18.5-NE)
75.8
(69.8-80.7)
23 24 25
10
1
HH
6
1
26 27
LO
5
1
0.28 (0.22-0.37)
P= 7.8 X 10⁻²²
3
1
28
T-DM1
6.8 (5.6-8.2)
34.1
(27.7-40.5)
2
1
29 30
0
1
0
1
31
32
00
0
1 0
BView entire presentation