J.P.Morgan Results Presentation Deck
Corporate ¹
SELECTED INCOME STATEMENT DATA ($MM)
Revenue
Net interest income
Noninterest revenue
Expense
Credit costs
Net income/(loss)
1 See note 1 on slide 10
JPMORGAN CHASE & CO.
$ 0/(U)
1Q23
$985
1,740
4Q22
($198)
442
(755)
(640)
(410)
160
(179)
(24)
370
384
341
$244 ($337) $1,100
1Q22
$1,866
2,276
CCB
CIB
CB
AWM Corp.
FINANCIAL PERFORMANCE
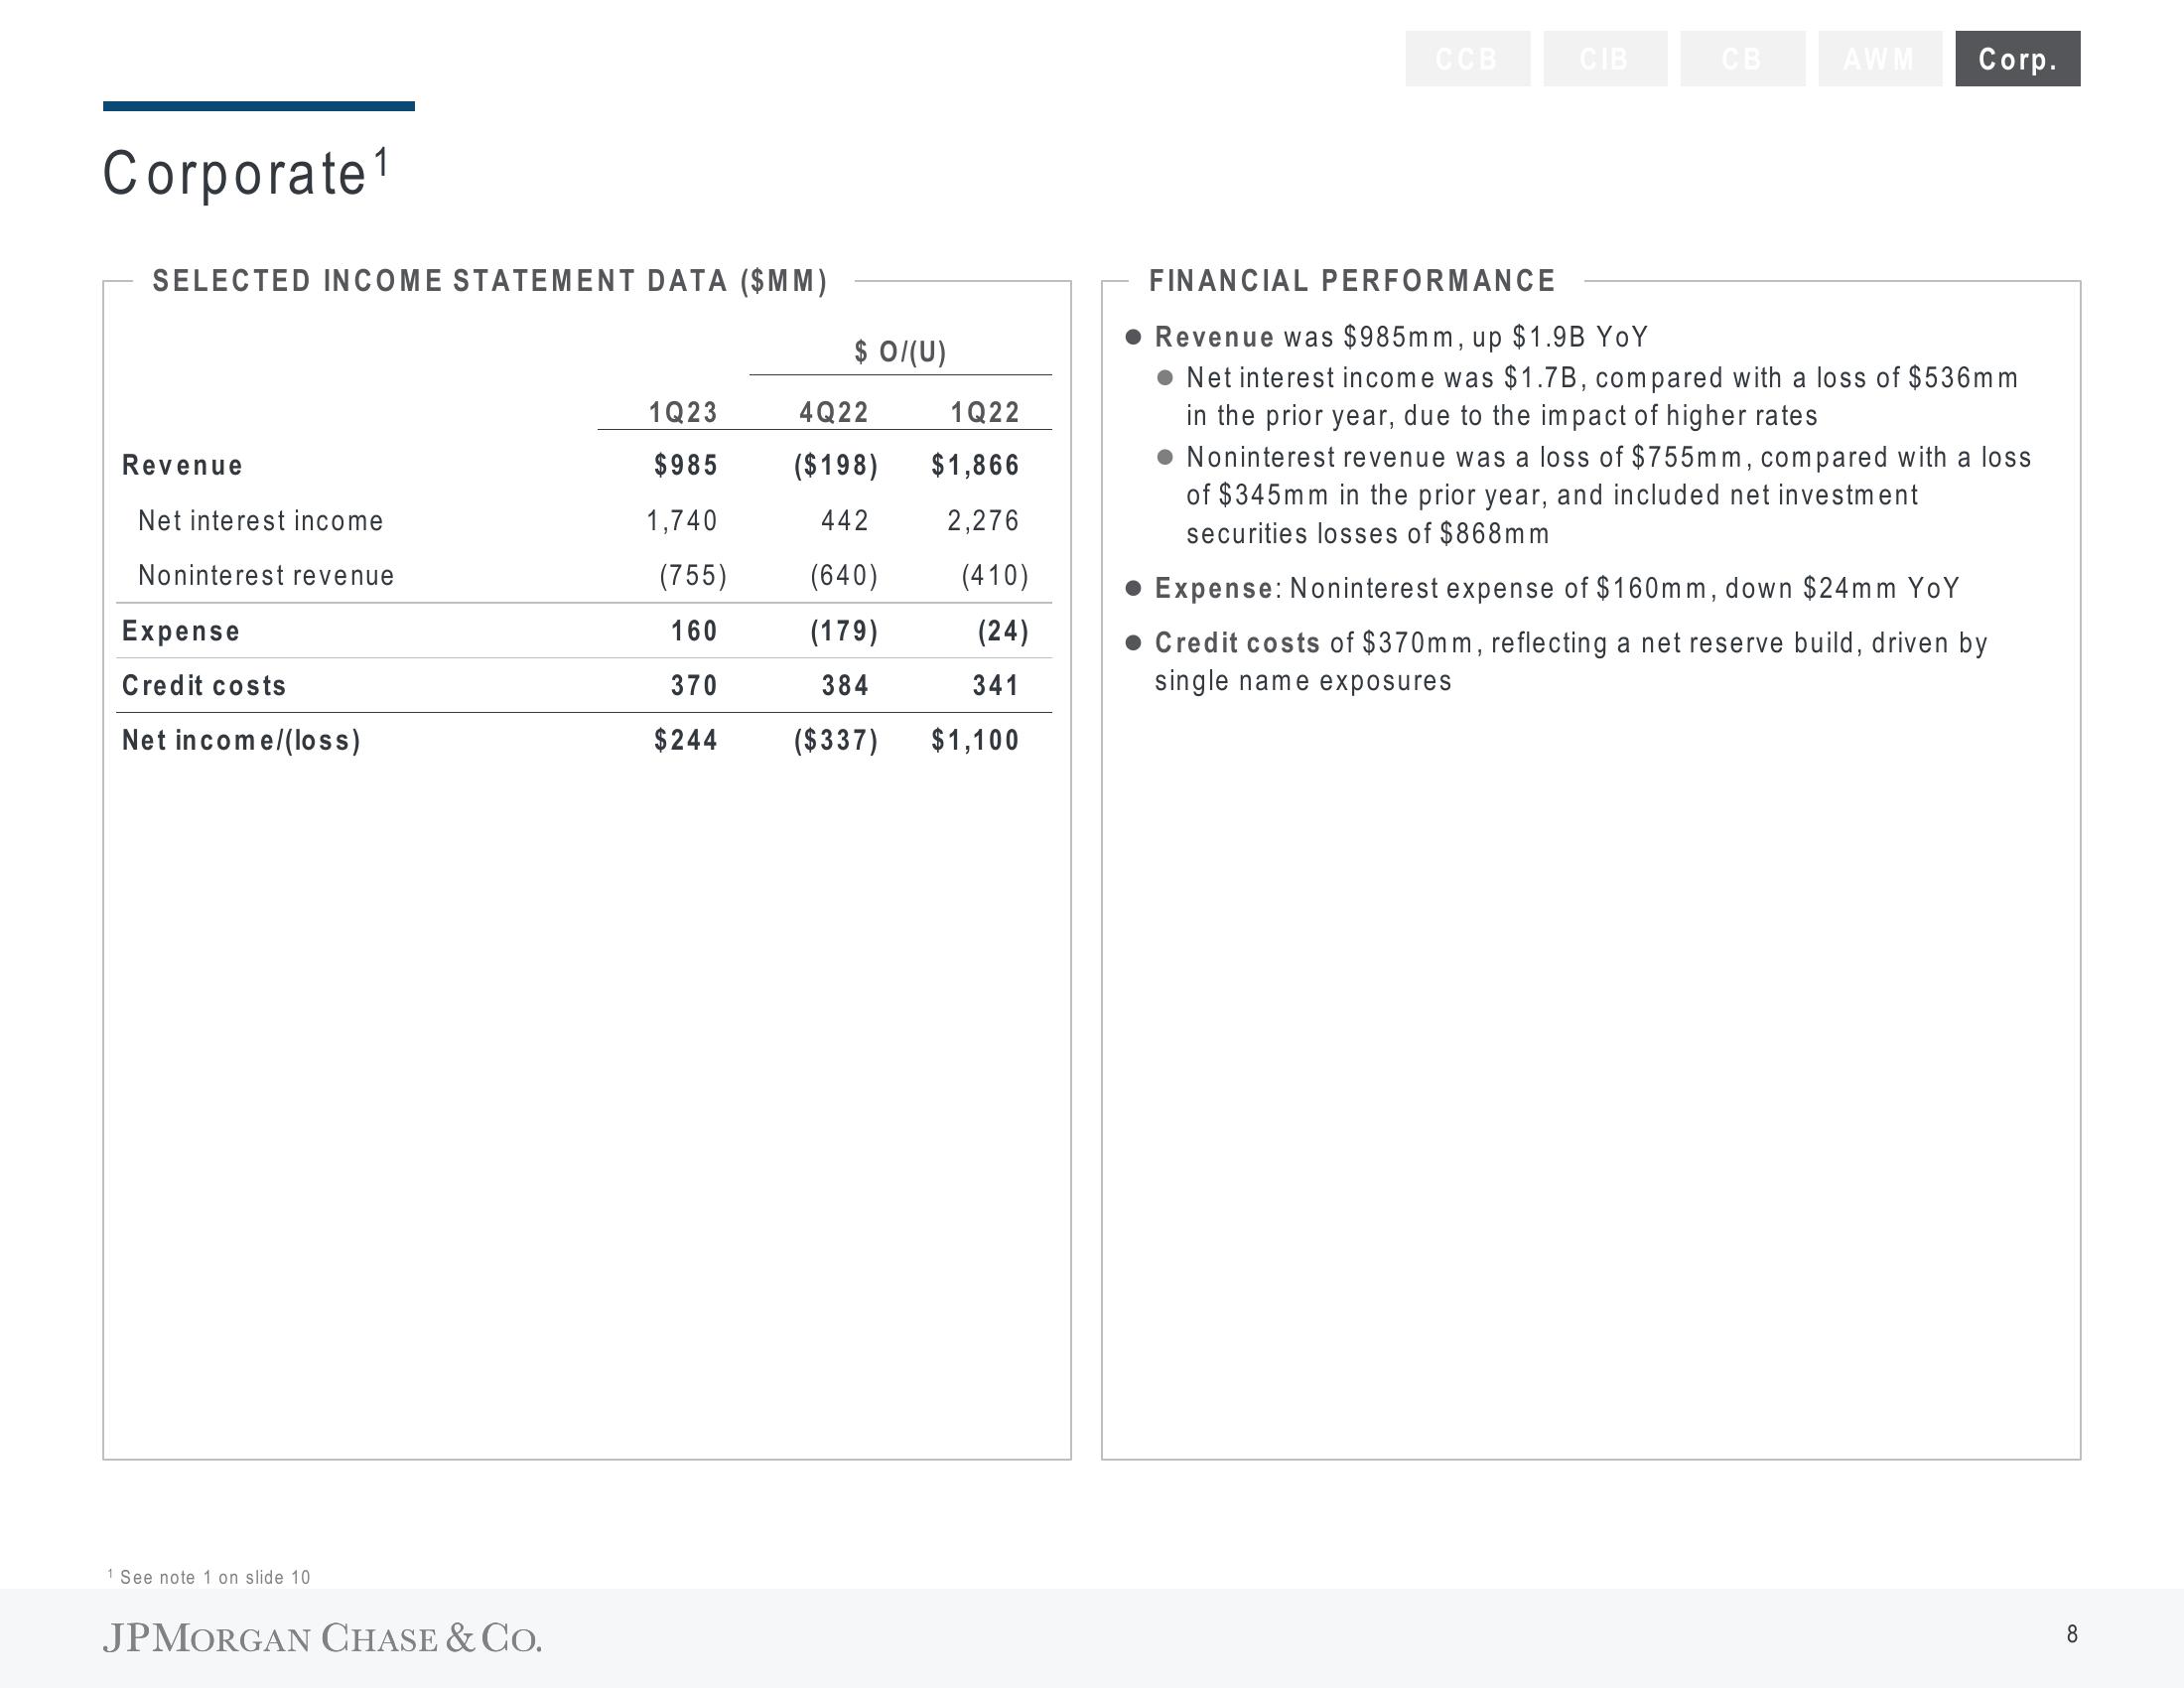
● Revenue was $985mm, up $1.9B YOY
• Net interest income was $1.7B, compared with a loss of $536mm
in the prior year, due to the impact of higher rates
• Noninterest revenue was a loss of $755mm, compared with a loss
of $345mm in the prior year, and included net investment
securities losses of $868mm
• Expense: Noninterest expense of $160mm, down $24mm YoY
● Credit costs of $370mm, reflecting a net reserve build, driven by
single name exposures
8View entire presentation