Allwyn Investor Conference Presentation Deck
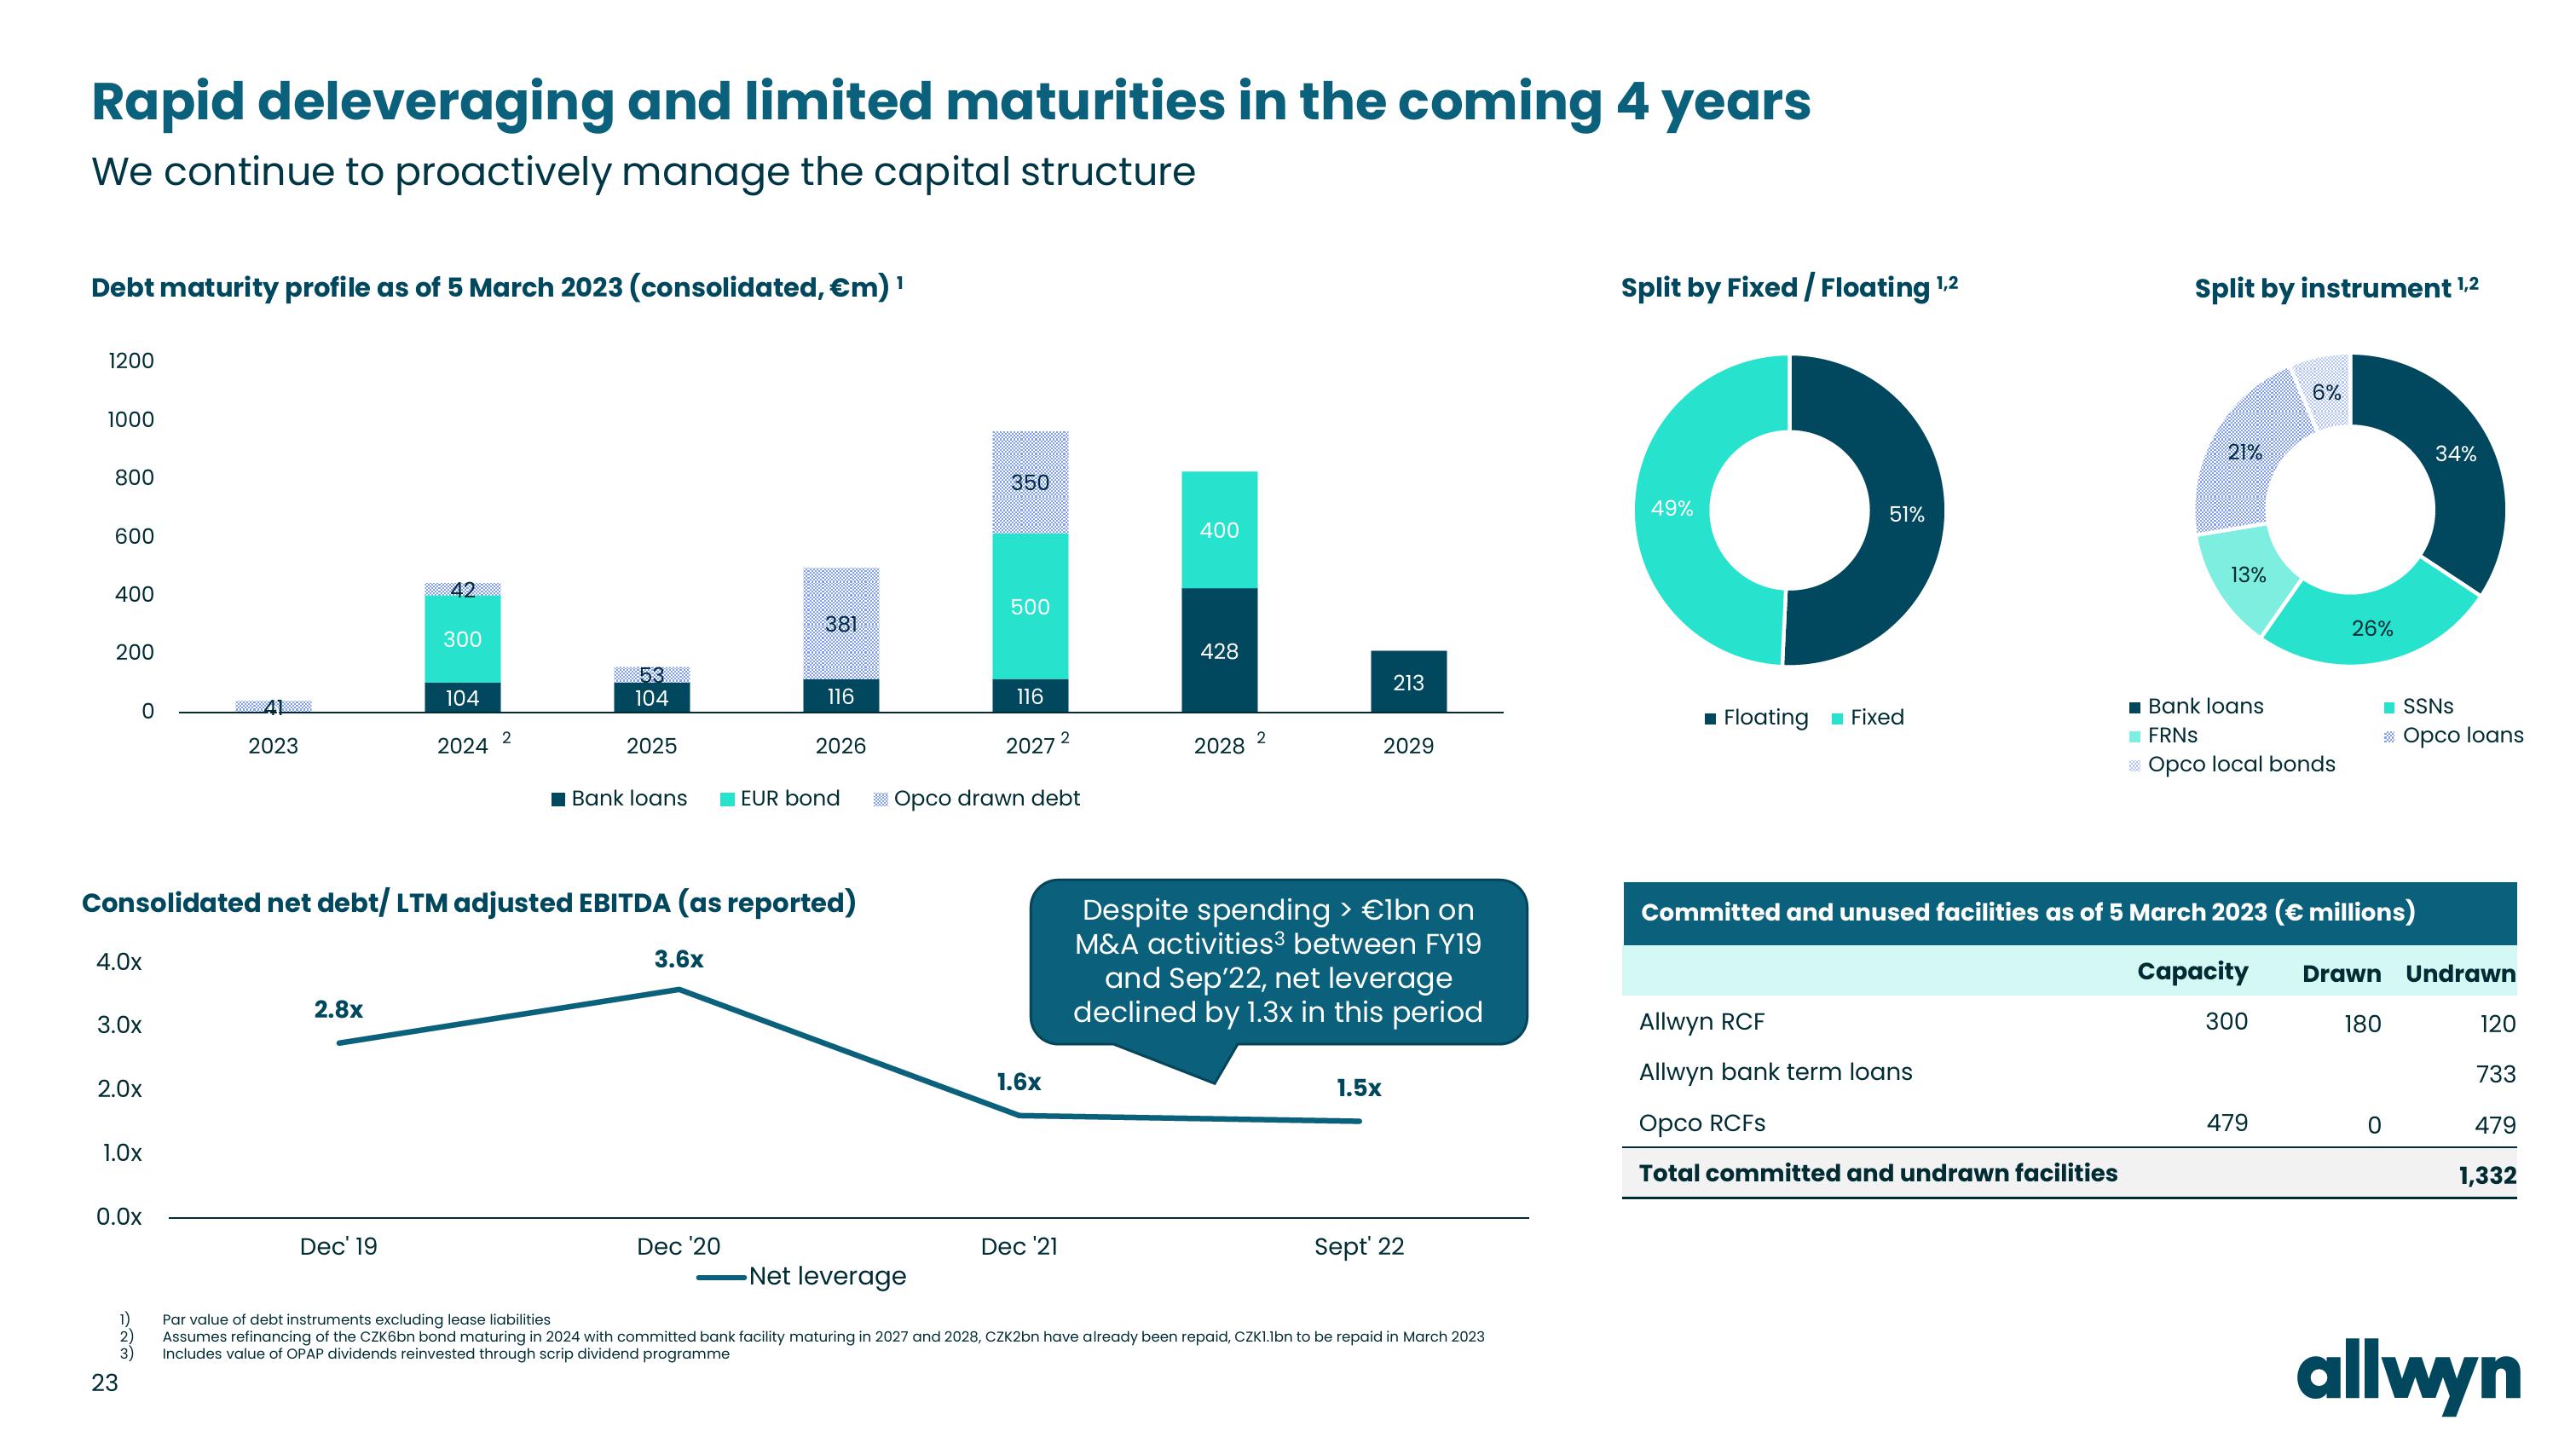
Rapid deleveraging and limited maturities in the coming 4 years
We continue to proactively manage the capital structure
1
Debt maturity profile as of 5 March 2023 (consolidated, €m) ¹
1200
1000
800
600
400
200
0
4.0x
3.0x
2.0x
1.0x
0.0x
1)
2)
3)
23
2023
2.8x
42
Dec' 19
300
104
2024
Consolidated net debt/ LTM adjusted EBITDA (as reported)
2
53
104
2025
Bank loans
3.6x
381
Dec '20
116
2026
EUR bond
350
500
116
2027
Opco drawn debt
1.6x
2
Dec '21
400
428
2028
2
213
2029
Despite spending > €1bn on
M&A activities3 between FY19
and Sep'22, net leverage
declined by 1.3x in this period
1.5x
Sept' 22
-Net leverage
Par value of debt instruments excluding lease liabilities
Assumes refinancing of the CZK6bn bond maturing in 2024 with committed bank facility maturing in 2027 and 2028, CZK2bn have already been repaid, CZK1.1bn to be repaid in March 2023
Includes value of OPAP dividends reinvested through scrip dividend programme
Split by Fixed / Floating 1,2
49%
51%
■ Floating Fixed
Split by instrument ¹,2
Allwyn RCF
Allwyn bank term loans
Opco RCFS
Total committed and undrawn facilities
21%
13%
■Bank loans
FRNS
>> Opco local bonds
6%
XXXXXX
Committed and unused facilities as of 5 March 2023 (€ millions)
300
26%
479
■SSNs
> Opco loans
Capacity Drawn Undrawn
34%
180
0
120
733
479
1,332
allwynView entire presentation