Kymera Results Presentation Deck
*
Maximum % Change from Baseline
-20 -
-40-
-60 -
-80
-100 -
HV
(MAD3)
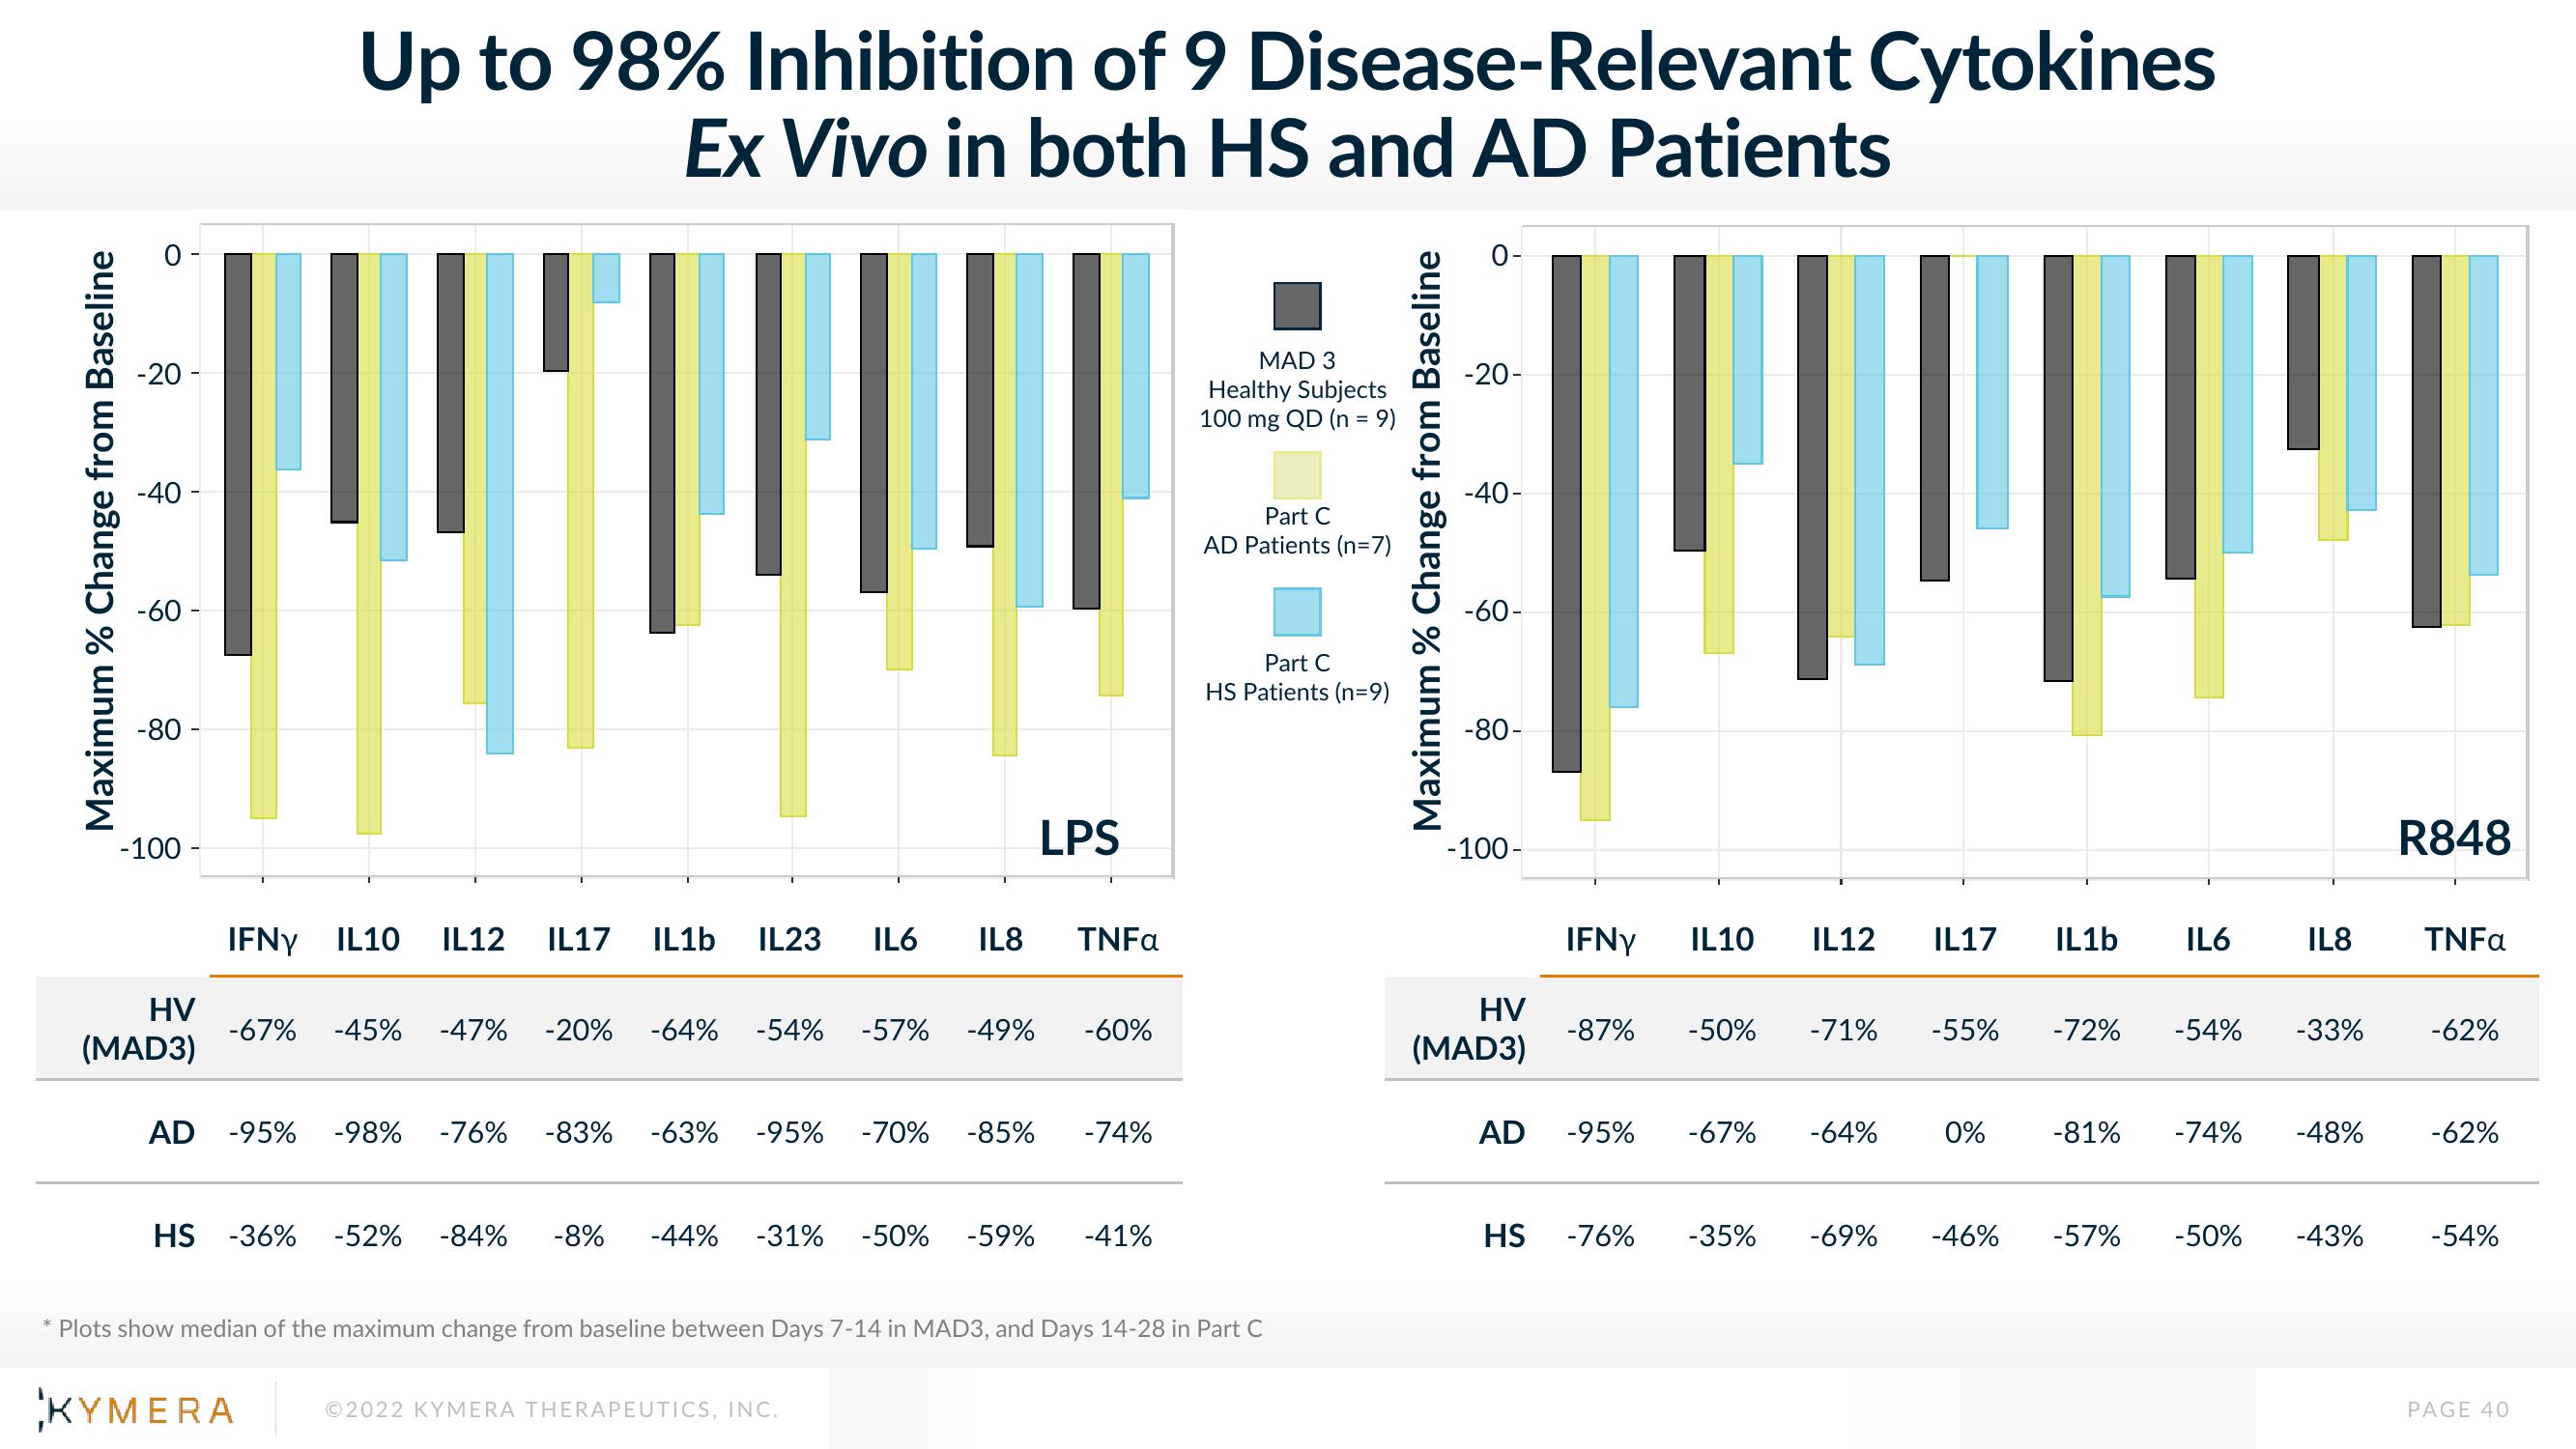
Up to 98% Inhibition of 9 Disease-Relevant Cytokines
Ex Vivo in both HS and AD Patients
|'|||||
peppe
IFNY IL10 IL12 IL17 IL1b IL23 IL6 IL8 TNFa
-67% -45% -47% -20% -64% -54%
AD -95% -98% -76%
KYMERA
LPS
HS -36% -52% -84% -8% -44% -31% -50% -59%
-57% -49% -60%
-83% -63% -95% -70% -85% -74%
Ⓒ2022 KYMERA THERAPEUTICS, INC.
-41%
MAD 3
Healthy Subjects
100 mg QD (n = 9)
Part C
AD Patients (n=7)
Plots show median of the maximum change from baseline between Days 7-14 in MAD3, and Days 14-28 in Part C
Part C
HS Patients (n=9)
Maximum % Change from Baseline
-20-
-40-
-60-
-80-
-100-
HV
(MAD3)
AD
HS
IFNY IL10 IL12 IL17 IL1b
-87%
-95%
-76%
-50%
-71% -55%
-67% -64%
0%
-72%
IL6
-54%
-81% -74%
-35% -69% -46% -57% -50%
IL8
-33%
-48%
-43%
R848
TNFa
-62%
-62%
-54%
PAGE 40View entire presentation