Bridge Investment Group Results Presentation Deck
DIFFERENTIATED DATA-DRIVEN INVESTMENT STRATEGY ENABLED BY
SPECIALIZED UNDERWRITING CAPABILITIES
Bridge's deep expertise and vertically integrated platform facilitate a comprehensive top-down
investment strategy supported by specialized asset level underwriting
Data-Driven
Top-Down
Investment
Strategy
Utilizes a comprehensive, data-driven approach to analyze
macroeconomic trends & identify compelling investment
opportunities
Analytical metrics include detailed demand forecasts, supply
forecasts and marking pricing, all at the local level
Extensive underwriting and transactional experience helps
secure off-market deals
Bridge's identified "target markets" are projected to outperform
substantially on key metrics
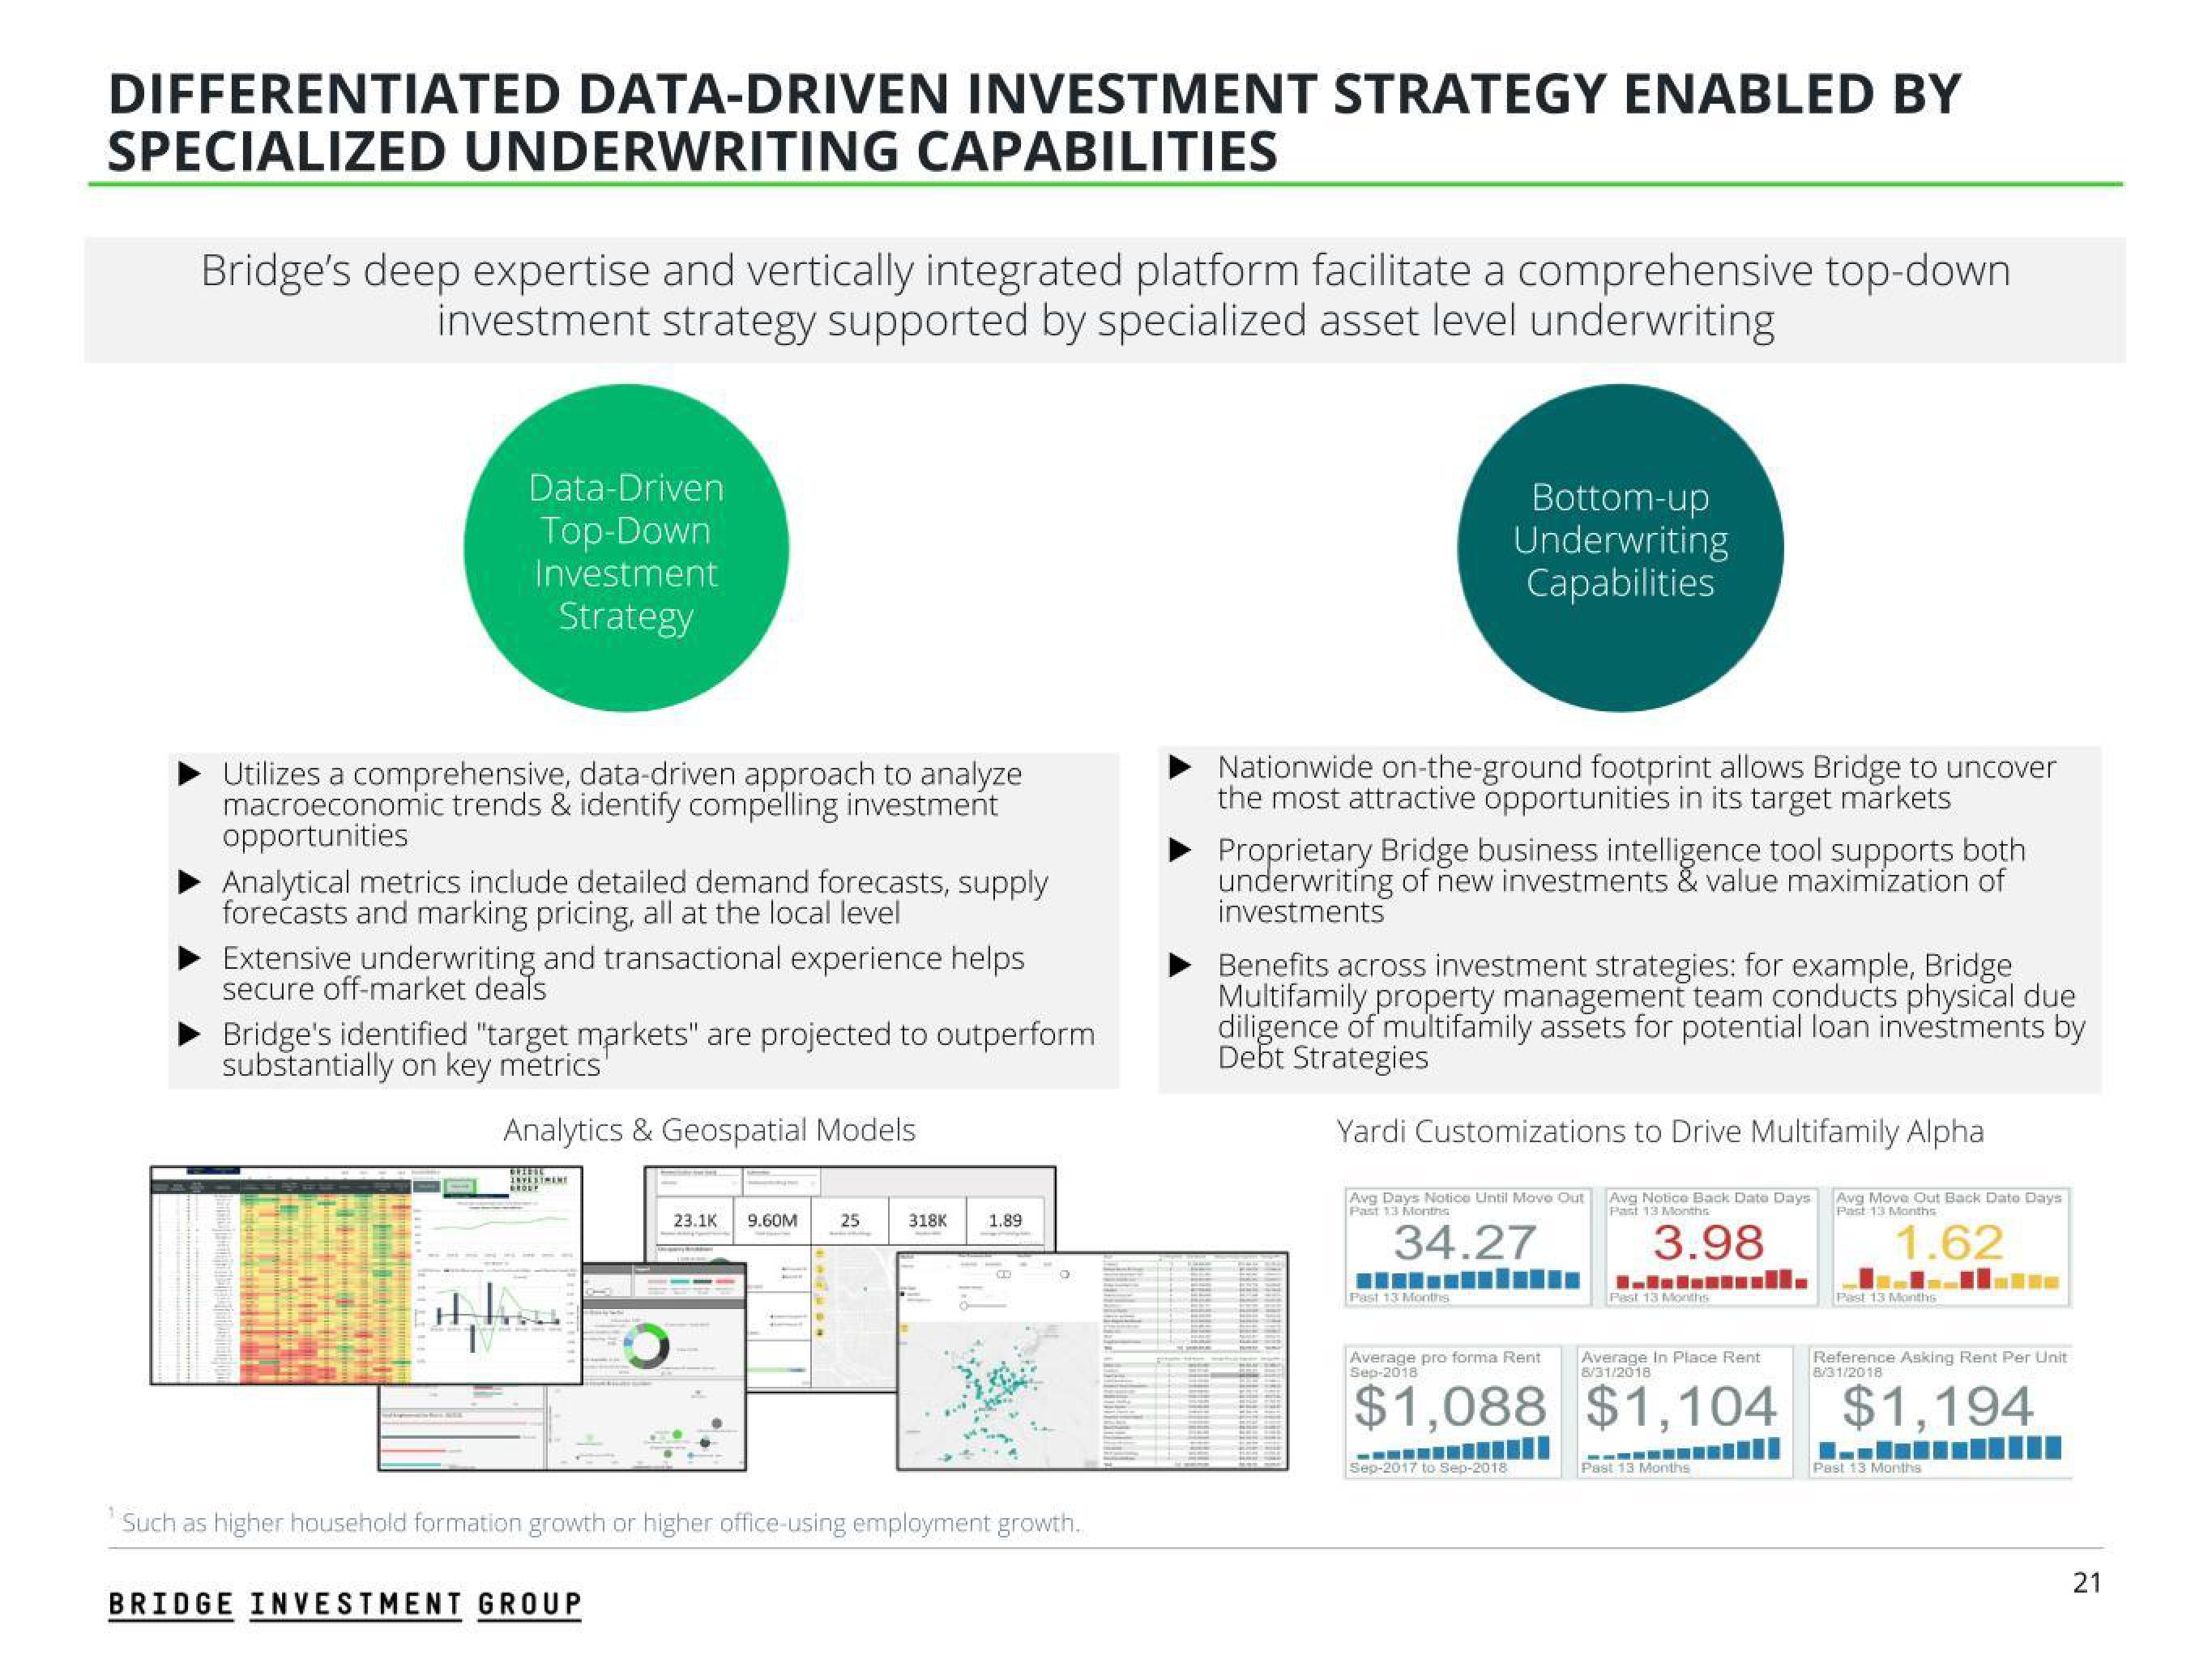
Analytics & Geospatial Models
GRIESE
INVESTMENT
23.1K 9.60M 25
BRIDGE INVESTMENT GROUP
318K 1.89
B
1
Such as higher household formation growth or higher office-using employment growth.
Nationwide on-the-ground footprint allows Bridge to uncover
the most attractive opportunities in its target markets
Bottom-up
Underwriting
Capabilities
Proprietary Bridge business intelligence tool supports both
underwriting of new investments & value maximization of
investments
Benefits across investment strategies: for example, Bridge
Multifamily property management team conducts physical due
diligence of multifamily assets for potential loan investments by
Debt Strategies
Yardi Customizations to Drive Multifamily Alpha
Avg Days Notice Until Move Out
Past 13 Months
Avg Notice Back Date Days
Past 13 Months
34.27
3.98
Past 13 Months
Average pro forma Rent
Sep-2018
Average In Place Rent
8/31/2018
$1,088 $1,104
Sep-2017 to Sep-2018
Past 13 Months
Past 13 Months
Avg Move Out Back Dato Days
Past 13 Months
1.62
Past 13 Months
Reference Asking Rent Per Unit
8/31/2018
$1,194
Past 13 Months
21View entire presentation