Shoals Results Presentation Deck
...THAT'S
GROWING FASTER
THAN THE OVERALL SOLAR MARKET
EBOS market has several
growth accelerants
Primarily ground mount, which is growing faster
than the overall market
Beneficiary of battery energy storage - both new
and retrofits
Rip and replace of existing solar fleet
EBOS for emerging EV charging market
(1) Based on IHS Solar Market Tracker - North America: First Half 2021, February 2021.
(2) Based on Wood Mackenzie U.S. Utility Solar-Plus-Storage: The Rise of Hybridization, August
2020. Assumes EBOS for solar + storage requires an additional 3¢ per watt of solar capacity.
(3) Assumes 5% of the utility scale solar fleet in operation at the end of 2018 (37.4 GW) is
replaced with new EBOS in 2023 at an average cost of 3.5¢ per watt.
(4) Based on BloombergNEF Charging Infrastructure Forecast Model (CIFM), January 2021.
Assumes none of "Hardware" spending was addressable in 2020 and 30% of "Hardware"
spending is addressable in 2023.
Note: Assumes constant ASPs.
shoals
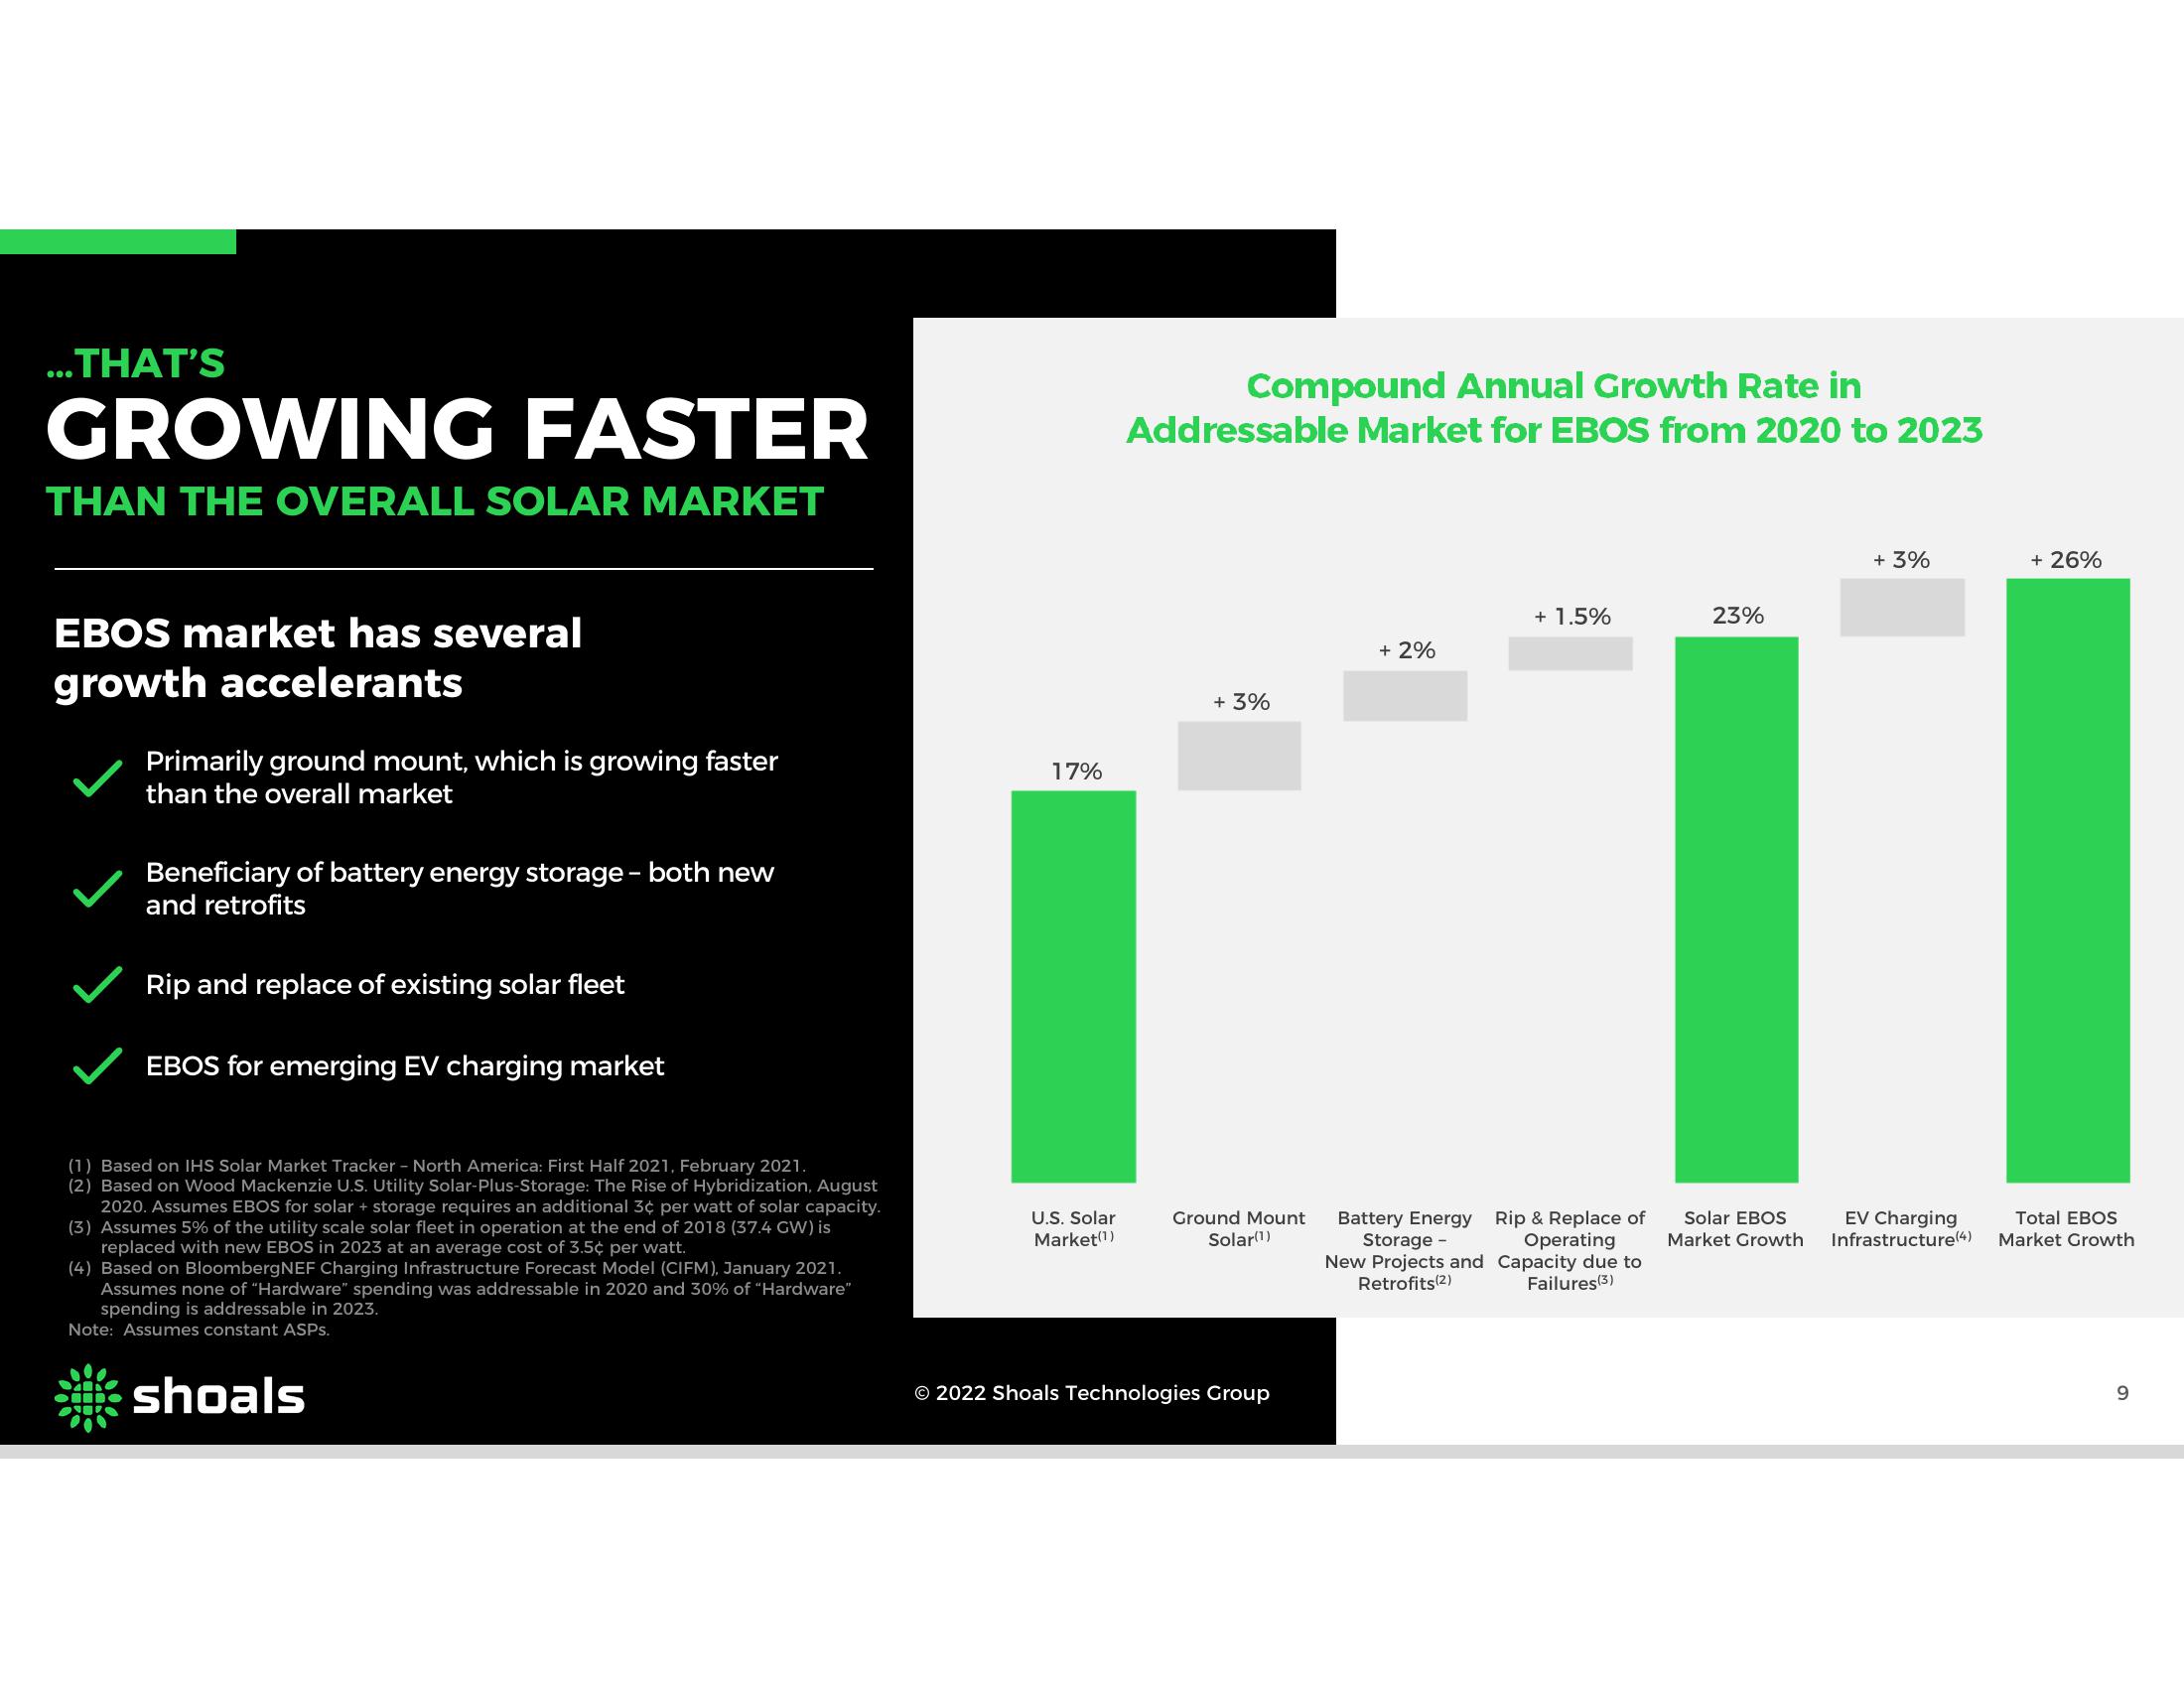
17%
U.S. Solar
Market (1)
Compound Annual Growth Rate in
Addressable Market for EBOS from 2020 to 2023
+ 3%
Ground Mount
Solar(1)
© 2022 Shoals Technologies Group
+ 2%
Battery Energy
Storage
New Projects and
Retrofits(2)
+ 1.5%
Rip & Replace of
Operating
Capacity due to
Failures (3)
23%
Solar EBOS
Market Growth
+ 3%
EV Charging
Infrastructure(4)
+ 26%
Total EBOS
Market Growth
9View entire presentation