Paycor Results Presentation Deck
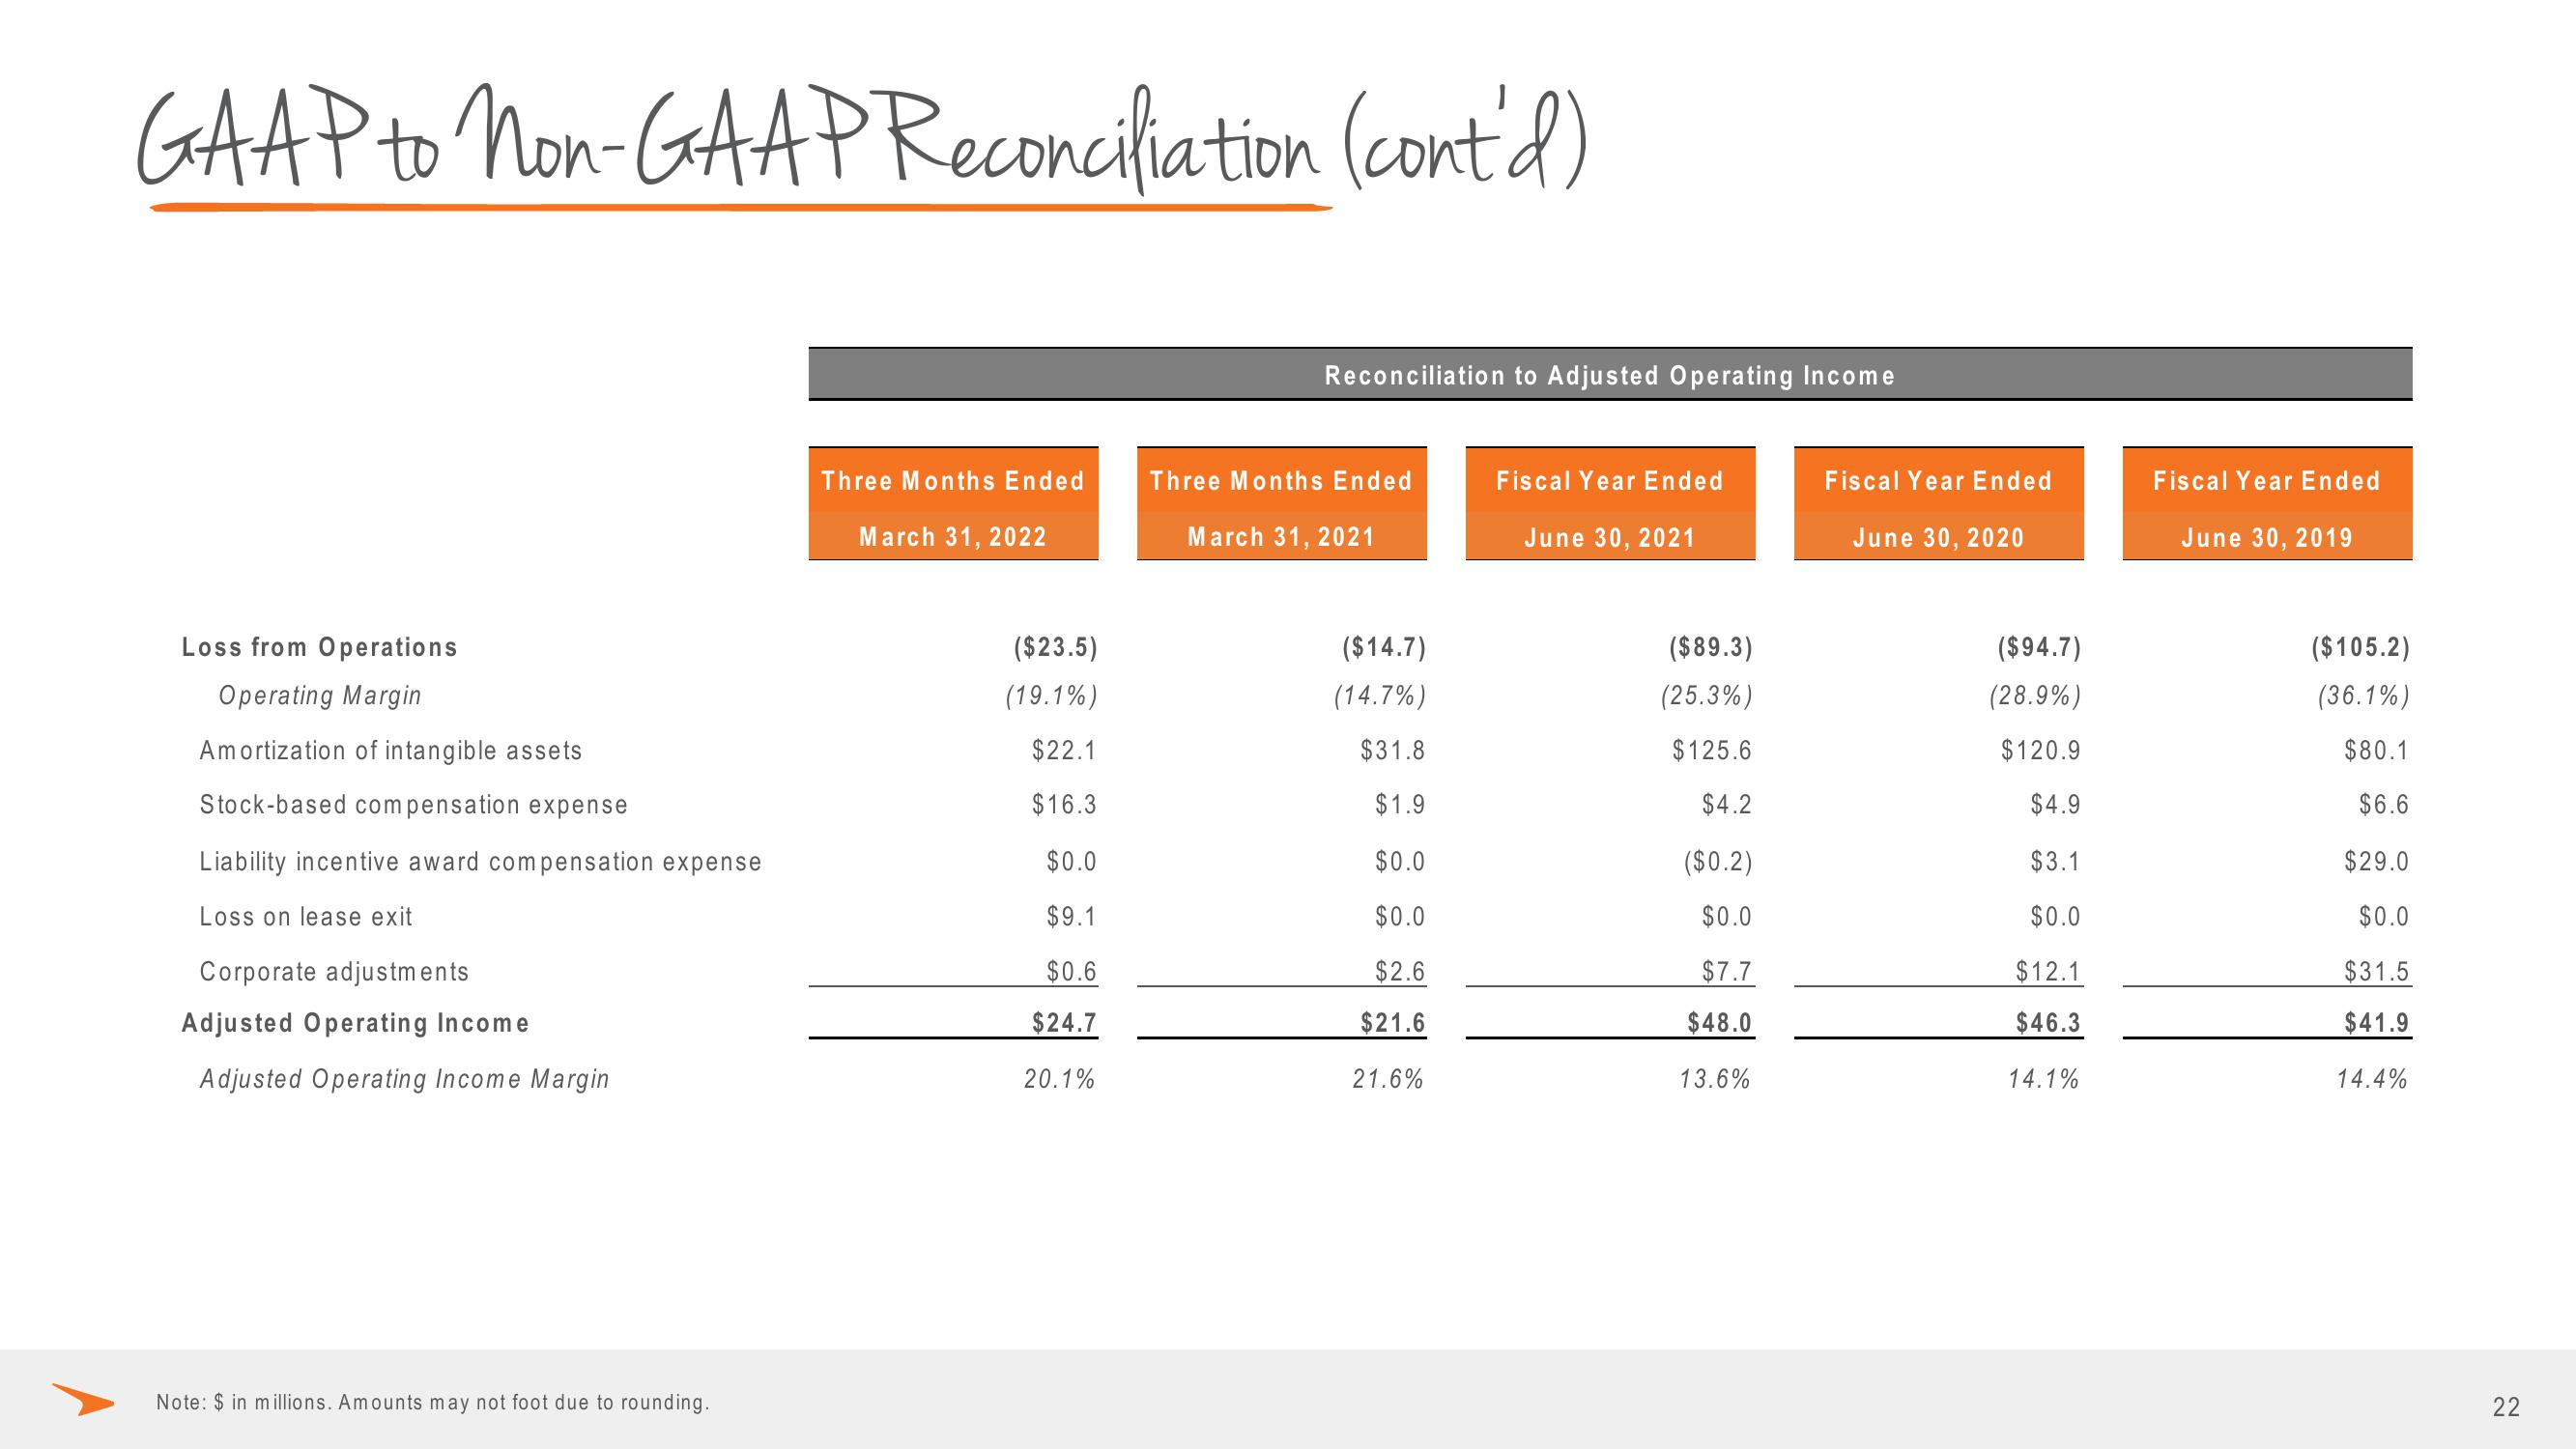
GAAP to Non-GAAP Reconciliation (cont'd)
Loss from Operations
Operating Margin
Amortization of intangible assets
Stock-based compensation expense
Liability incentive award compensation expense
Loss on lease exit
Corporate adjustments
Adjusted Operating Income
Adjusted Operating Income Margin
Note: $ in millions. Amounts may not foot due to rounding.
Three Months Ended
March 31, 2022
($23.5)
(19.1%)
$22.1
$16.3
$0.0
$9.1
$0.6
$24.7
20.1%
Reconciliation to Adjusted Operating Income
Three Months Ended
March 31, 2021
($14.7)
(14.7%)
$31.8
$1.9
$0.0
$0.0
$2.6
$21.6
21.6%
Fiscal Year Ended
June 30, 2021
($89.3)
(25.3%)
$125.6
$4.2
($0.2)
$0.0
$7.7
$48.0
13.6%
Fiscal Year Ended
June 30, 2020
($94.7)
(28.9%)
$120.9
$4.9
$3.1
$0.0
$12.1
$46.3
14.1%
Fiscal Year Ended
June 30, 2019
($105.2)
(36.1%)
$80.1
$6.6
$29.0
$0.0
$31.5
$41.9
14.4%
22View entire presentation