DraftKings Investor Day Presentation Deck
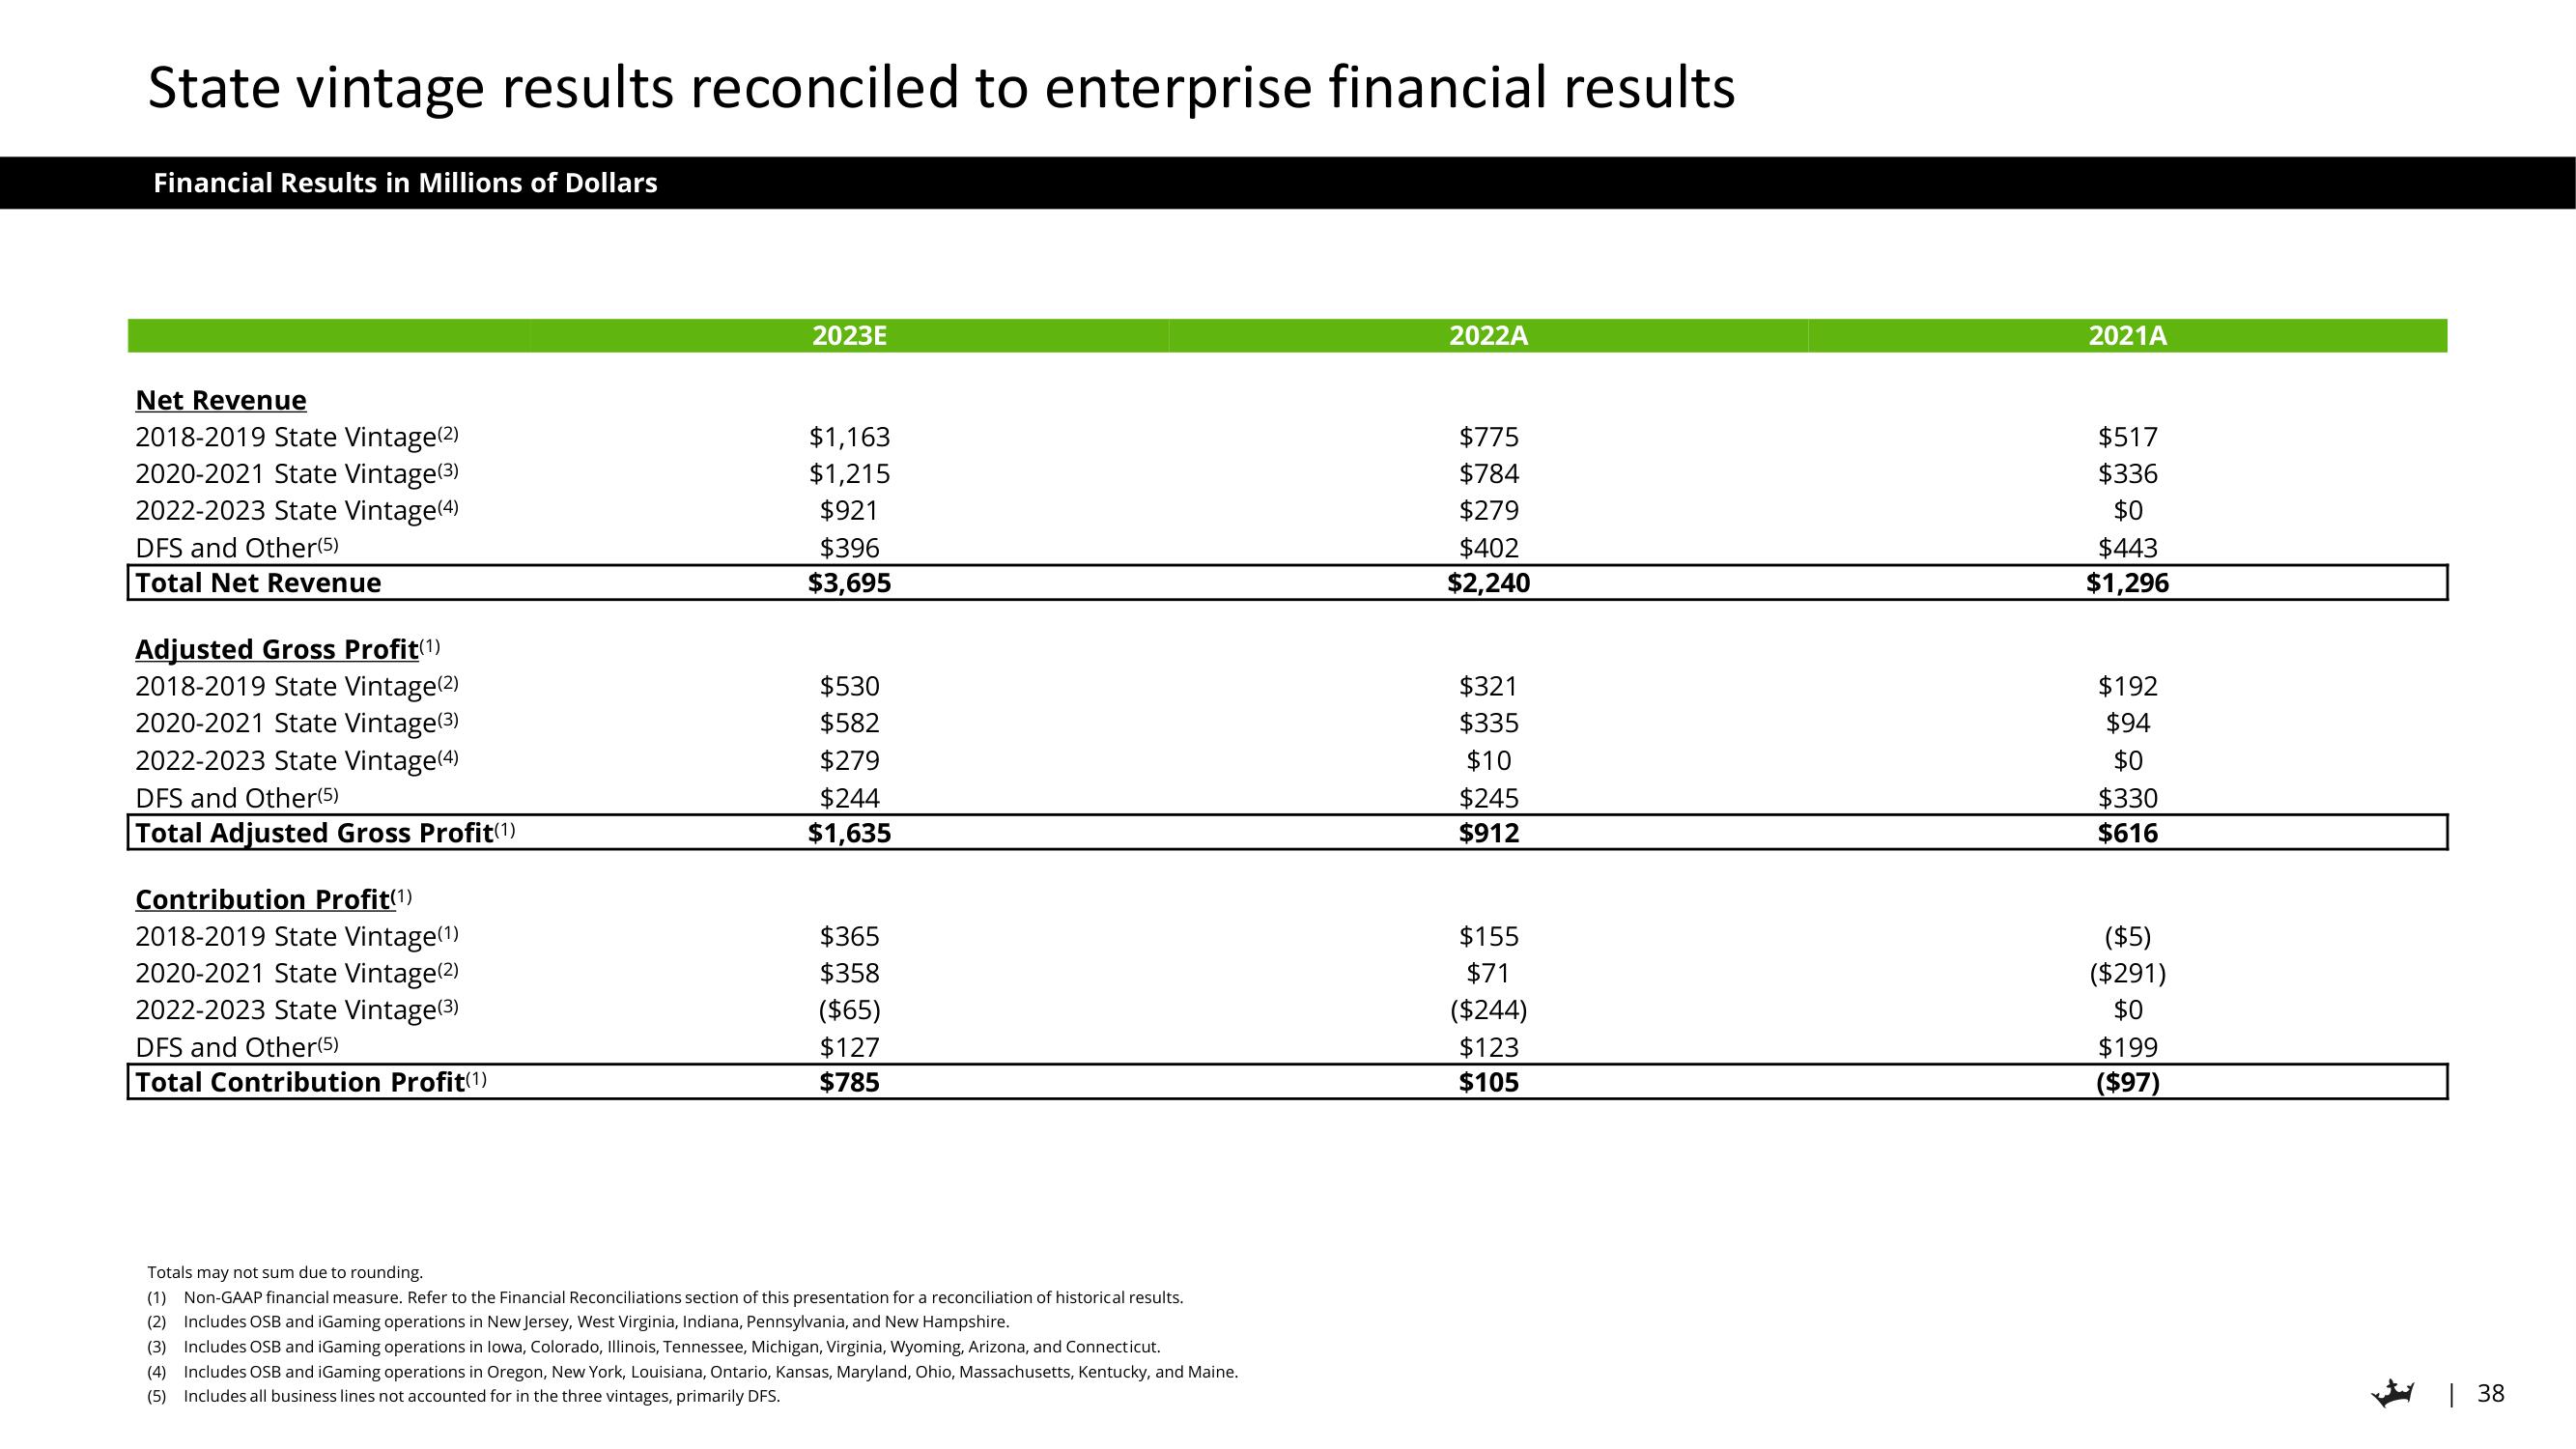
State vintage results reconciled to enterprise financial results
Financial Results in Millions of Dollars
Net Revenue
2018-2019 State Vintage(2)
2020-2021 State Vintage(3)
2022-2023 State Vintage(4)
DFS and Other(5)
Total Net Revenue
Adjusted Gross Profit(1)
2018-2019 State Vintage(2)
2020-2021 State Vintage(3)
2022-2023 State Vintage(4)
DFS and Other(5)
Total Adjusted Gross Profit(1)
Contribution Profit(1)
2018-2019 State Vintage(1)
2020-2021 State Vintage (2)
2022-2023 State Vintage(³)
DFS and Other(5)
Total Contribution Profit(1)
2023E
$1,163
$1,215
$921
$396
$3,695
$530
$582
$279
$244
$1,635
$365
$358
($65)
$127
$785
Totals may not sum due to rounding.
(1) Non-GAAP financial measure. Refer to the Financial Reconciliations section of this presentation for a reconciliation of historical results.
(2) Includes OSB and iGaming operations in New Jersey, West Virginia, Indiana, Pennsylvania, and New Hampshire.
(3) Includes OSB and iGaming operations in lowa, Colorado, Illinois, Tennessee, Michigan, Virginia, Wyoming, Arizona, and Connecticut.
(4) Includes OSB and iGaming operations in Oregon, New York, Louisiana, Ontario, Kansas, Maryland, Ohio, Massachusetts, Kentucky, and Maine.
(5) Includes all business lines not accounted for in the three vintages, primarily DFS.
2022A
$775
$784
$279
$402
$2,240
$321
$335
$10
$245
$912
$155
$71
($244)
$123
$105
2021A
$517
$336
$0
$443
$1,296
$192
$94
$0
$330
$616
($5)
($291)
$0
$199
($97)
| 38View entire presentation