Investor Presentation
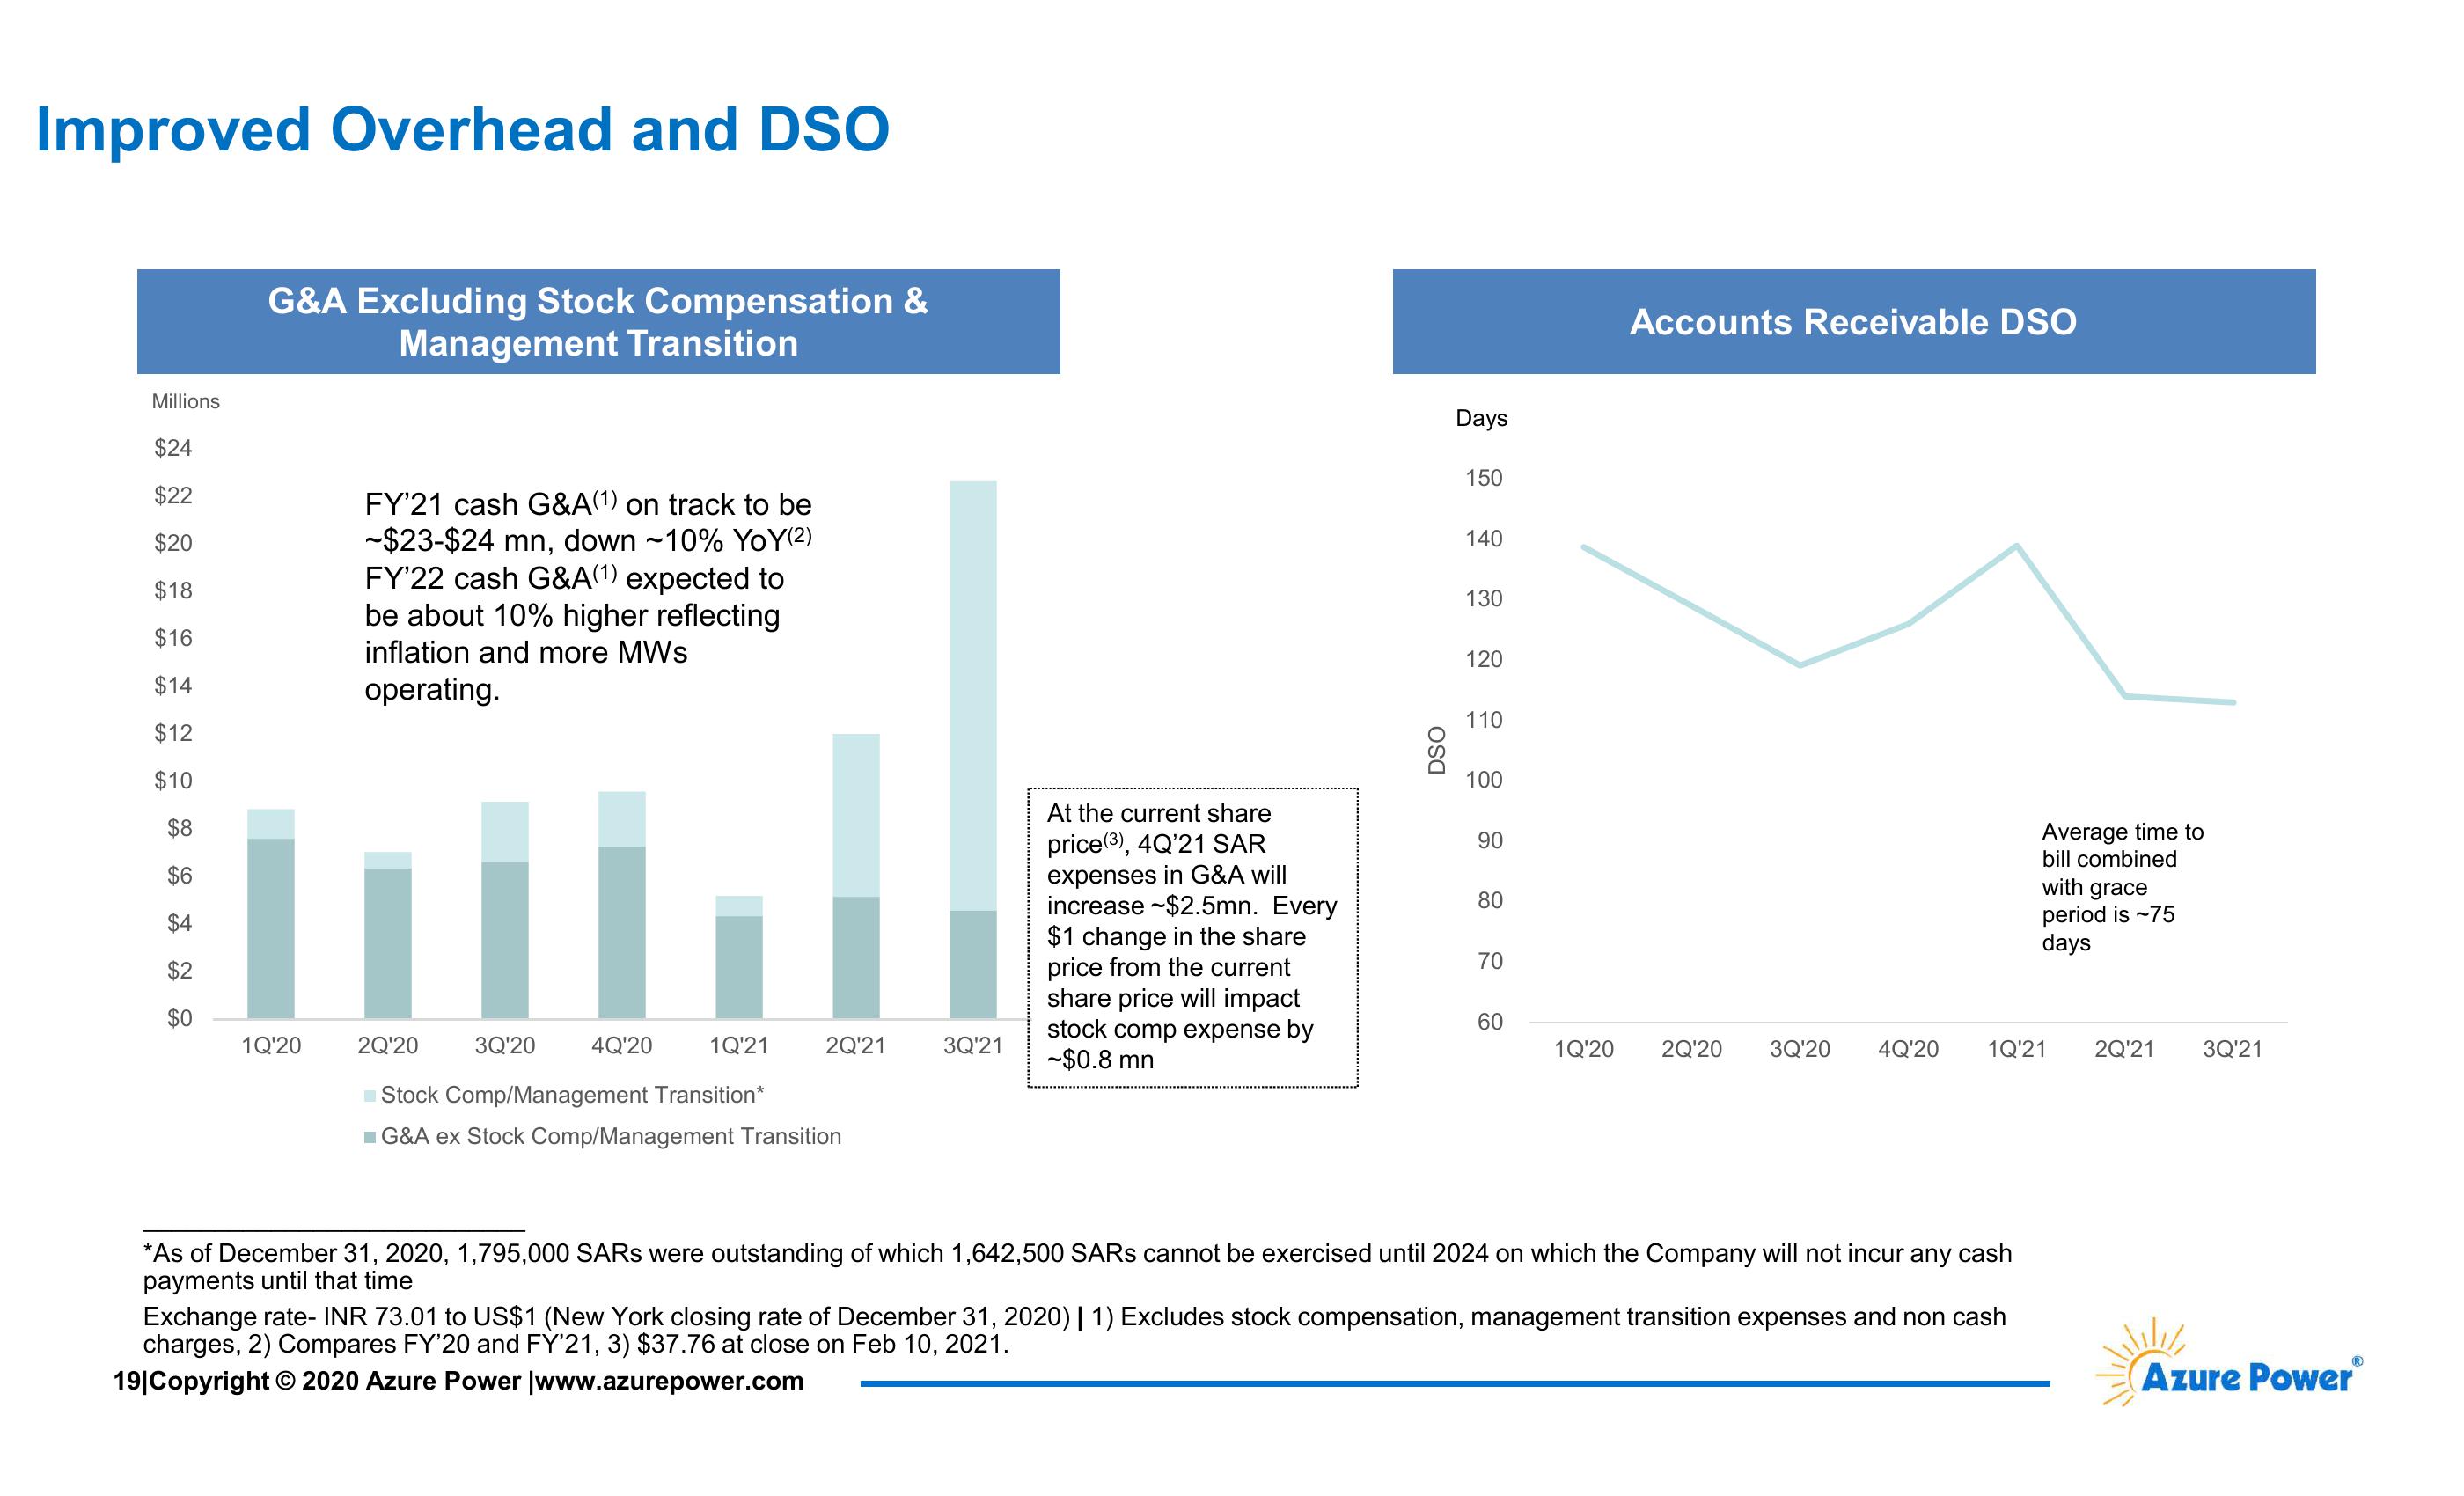
Improved Overhead and DSO
Millions
$24
G&A Excluding Stock Compensation &
Management Transition
$22
$20
$18
$16
$14
FY'21 cash G&A(1) on track to be
~$23-$24 mn, down ~10% YoY(2)
FY'22 cash G&A(1) expected to
be about 10% higher reflecting
inflation and more MWs
operating.
$12
$10
$8
$6
$4
$2
$0
1Q'20
2Q'20
3Q'20
DSO
Days
150
140
130
120
110
100
Accounts Receivable DSO
At the current share
price (3), 4Q'21 SAR
90
expenses in G&A will
increase $2.5mn. Every
80
$1 change in the share
Average time to
bill combined
with grace
period is ~75
days
price from the current
70
4Q'20
1Q'21
2Q'21
3Q'21
share price will impact
stock comp expense by
~$0.8 mn
60
1Q'20
2Q'20
3Q'20
4Q'20
1Q'21
2Q'21
3Q'21
Stock Comp/Management Transition*
■G&A ex Stock Comp/Management Transition
*As of December 31, 2020, 1,795,000 SARs were outstanding of which 1,642,500 SARS cannot be exercised until 2024 on which the Company will not incur any cash
payments until that time
Exchange rate- INR 73.01 to US$1 (New York closing rate of December 31, 2020) | 1) Excludes stock compensation, management transition expenses and non cash
charges, 2) Compares FY'20 and FY'21, 3) $37.76 at close on Feb 10, 2021.
19|Copyright © 2020 Azure Power |www.azurepower.com
®
Azure PowerⓇView entire presentation