Modeling with New Disclosures Linking Price & Drivers to Financial Results
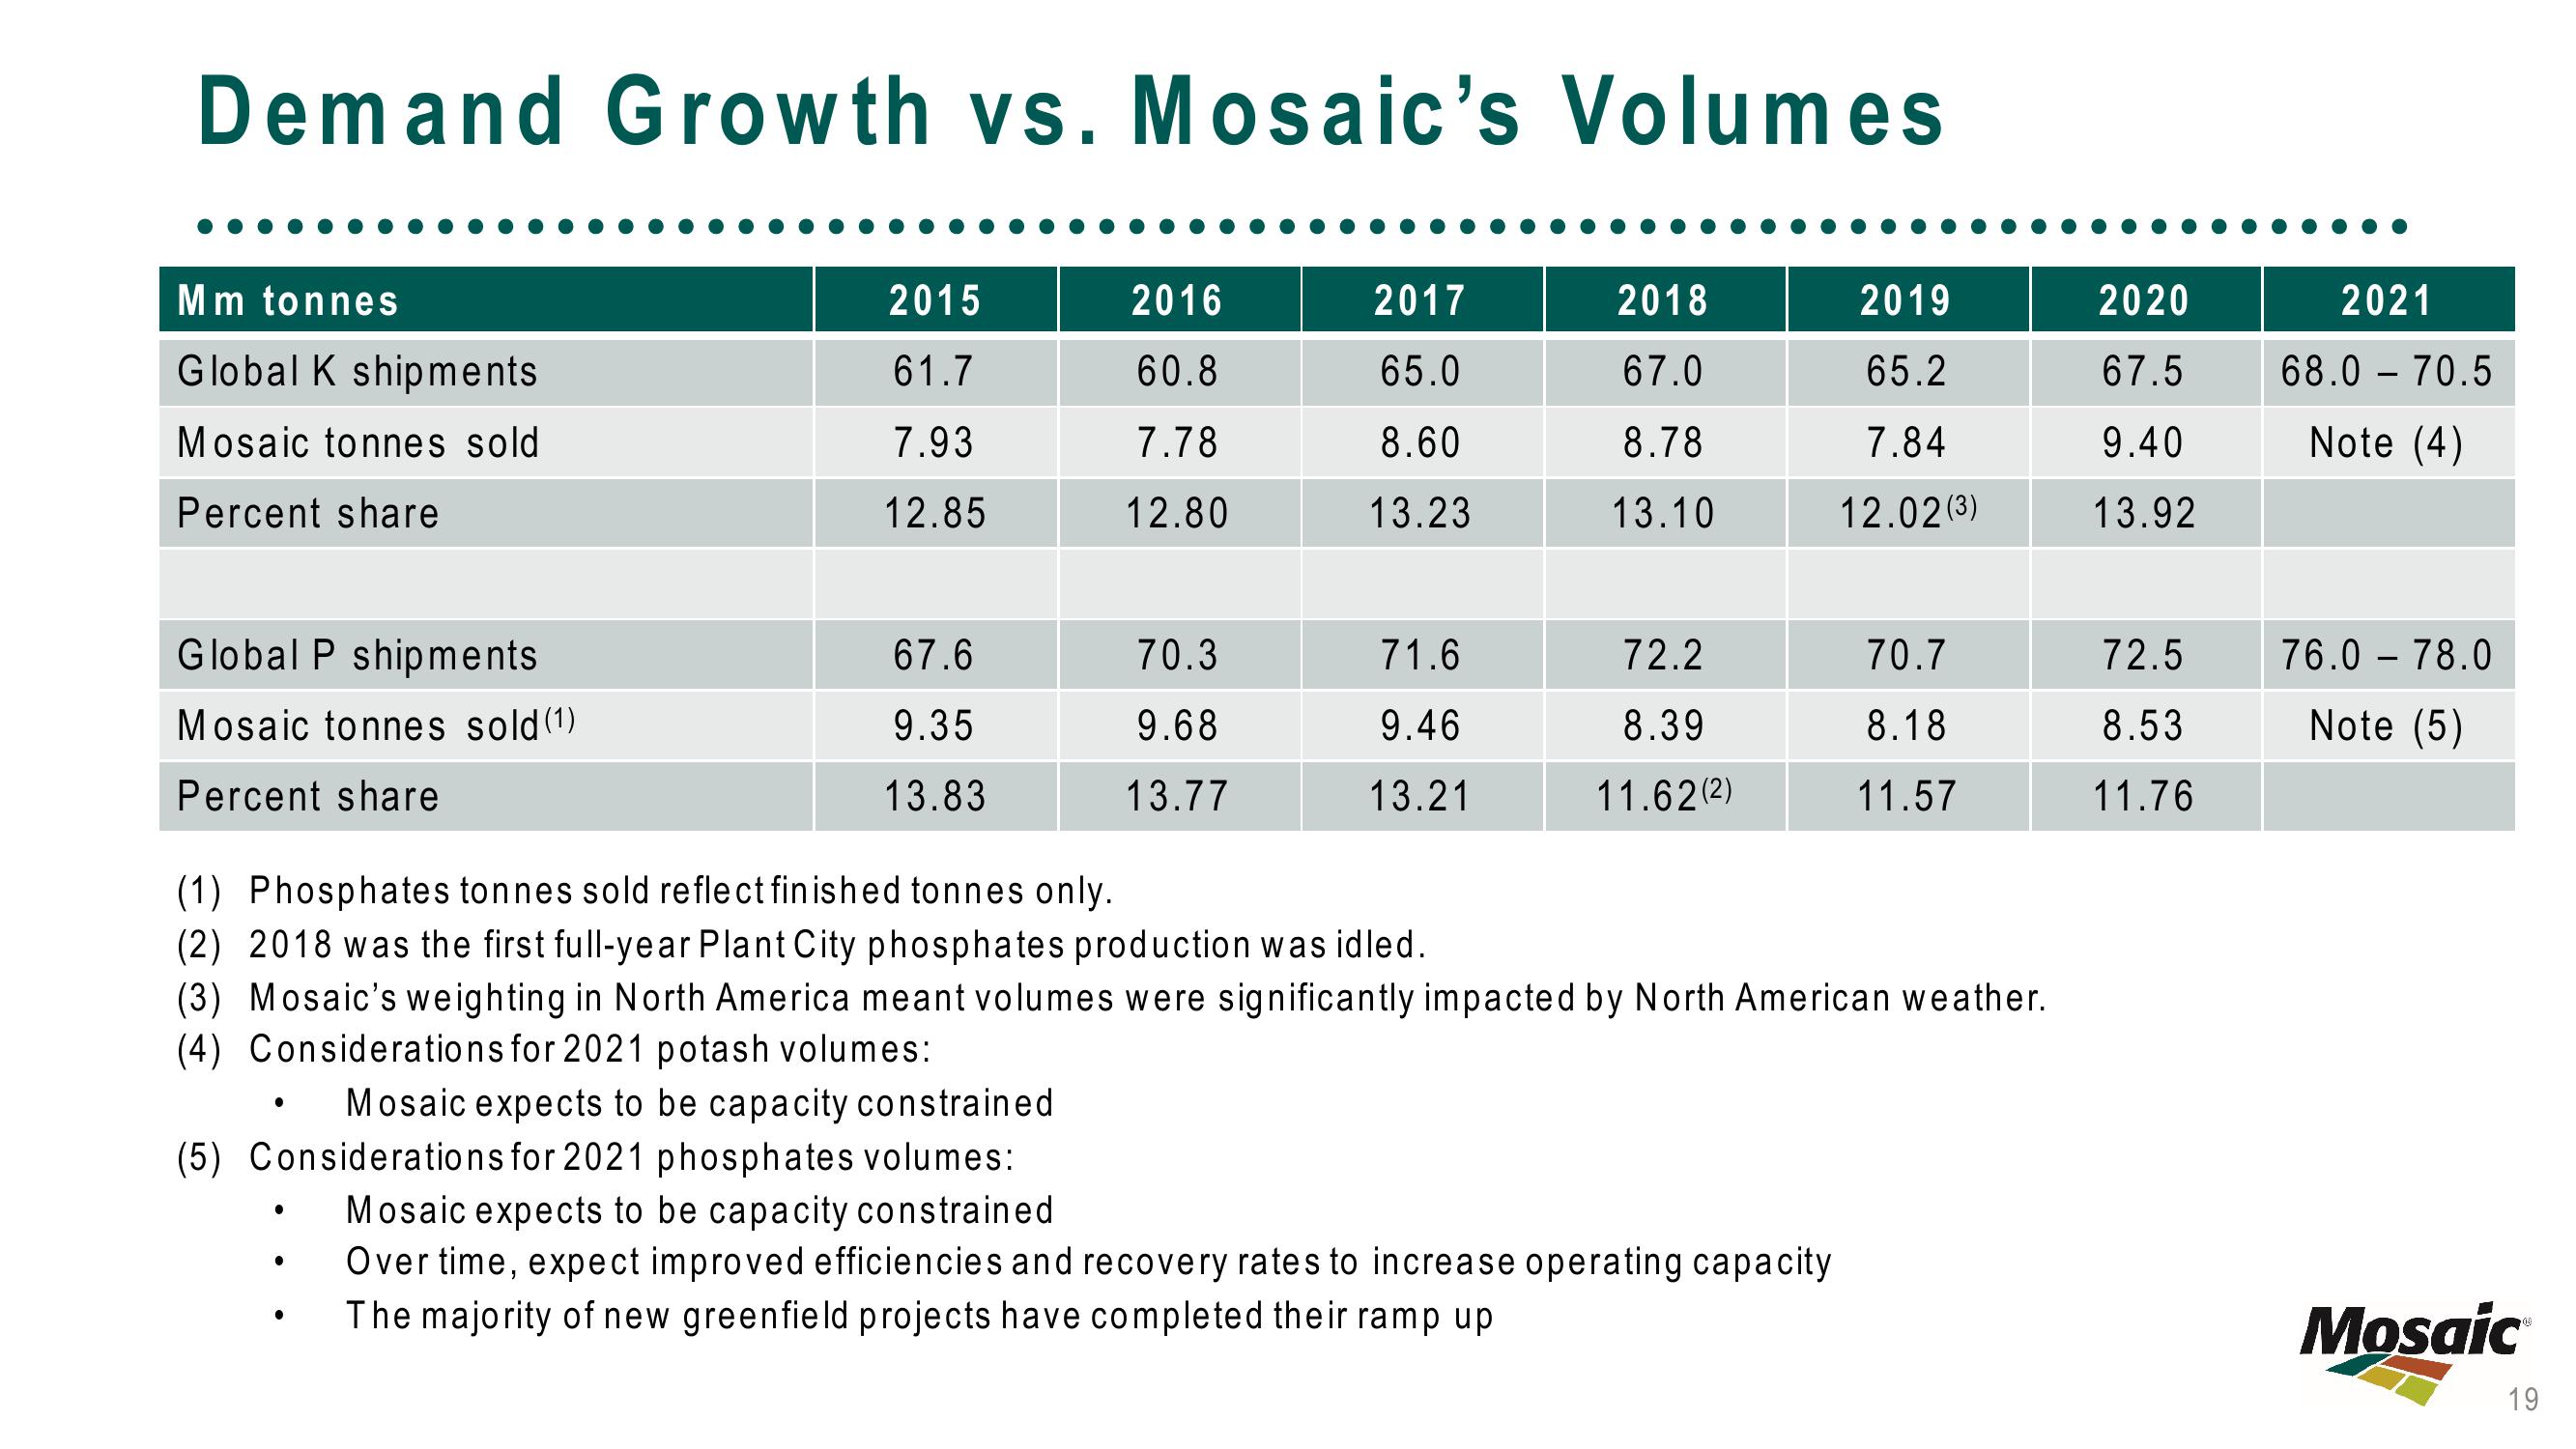
Demand Growth vs. Mosaic's Volumes
Mm tonnes
Global K shipments
Mosaic tonnes sold
Percent share
Global P shipments
Mosaic tonnes sold (1)
Percent share
●
2015
61.7
7.93
12.85
●
67.6
9.35
13.83
●
2016
60.8
7.78
12.80
70.3
9.68
13.77
2017
65.0
8.60
13.23
71.6
9.46
13.21
2018
67.0
8.78
13.10
Mosaic expects to be capacity constrained
(5) Considerations for 2021 phosphates volumes:
Mosaic expects to be capacity constrained.
Over time, expect improved efficiencies and recovery rates to increase operating capacity
The majority of new greenfield projects have completed their ramp up
72.2
8.39
11.62 (2)
(1) Phosphates tonnes sold reflect finished tonnes only.
(2) 2018 was the first full-year Plant City phosphates production was idled.
(3) Mosaic's weighting in North America meant volumes were significantly impacted by North American weather.
(4) Considerations for 2021 potash volumes:
2019
65.2
7.84
12.02 (3)
70.7
8.18
11.57
2020
67.5
9.40
13.92
72.5
8.53
11.76
2021
68.0 - 70.5
Note (4)
76.0 78.0
Note (5)
Mosaic
19View entire presentation