Factset Investor Day Presentation Deck
FACTSET
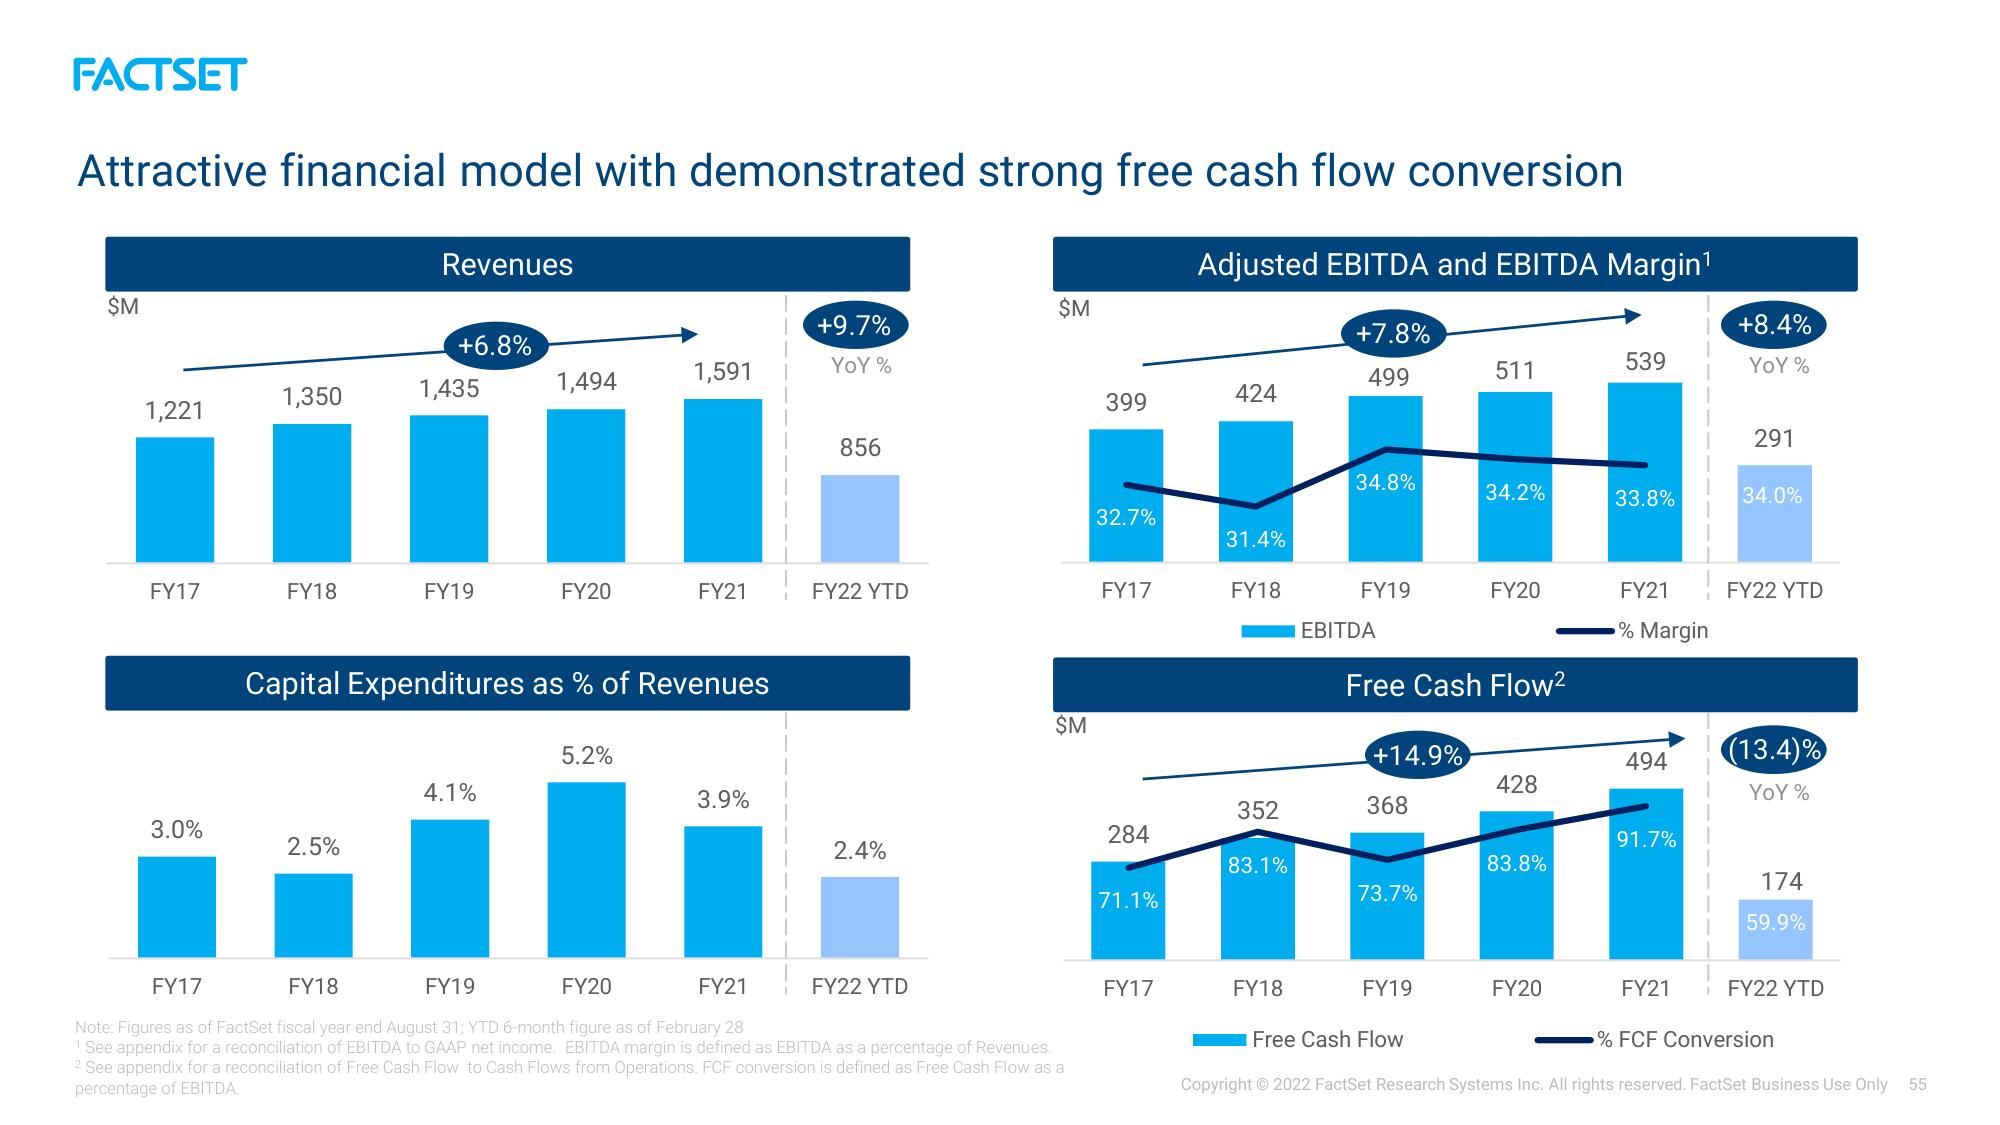
Attractive financial model with demonstrated strong free cash flow conversion
Adjusted EBITDA and EBITDA Margin¹
$M
1,221
FY17
3.0%
1,350
FY18
Revenues
2.5%
+6.8%
1,435
FY19
1,494
4.1%
FY20
Capital Expenditures as % of Revenues
1,591
5.2%
FY21
3.9%
+9.7%
YOY %
856
FY22 YTD
2.4%
$M
FY22 YTD
$M
FY17
FY18
FY19
FY20
FY21
Note: Figures as of FactSet fiscal year end August 31; YTD 6-month figure as of February 28
¹ See appendix for a reconciliation of EBITDA to GAAP net income. EBITDA margin is defined as EBITDA as a percentage of Revenues.
2 See appendix for a reconciliation of Free Cash Flow to Cash Flows from Operations. FCF conversion is defined as Free Cash Flow as a
percentage of EBITDA.
399
32.7%
FY17
284
71.1%
FY17
424
31.4%
FY18
352
83.1%
FY18
+7.8%
499
34.8%
FY19
EBITDA
+14.9%
368
Free Cash Flow²
73.7%
511
FY19
34.2%
FY20
428
83.8%
FY20
539
33.8%
FY21
% Margin
494
91.7%
FY21
+8.4%
YOY %
291
34.0%
FY22 YTD
(13.4)%
YOY%
174
59.9%
FY22 YTD
Free Cash Flow
% FCF Conversion
Copyright © 2022 FactSet Research Systems Inc. All rights reserved. FactSet Business Use Only 55View entire presentation