Hostess Investor Presentation Deck
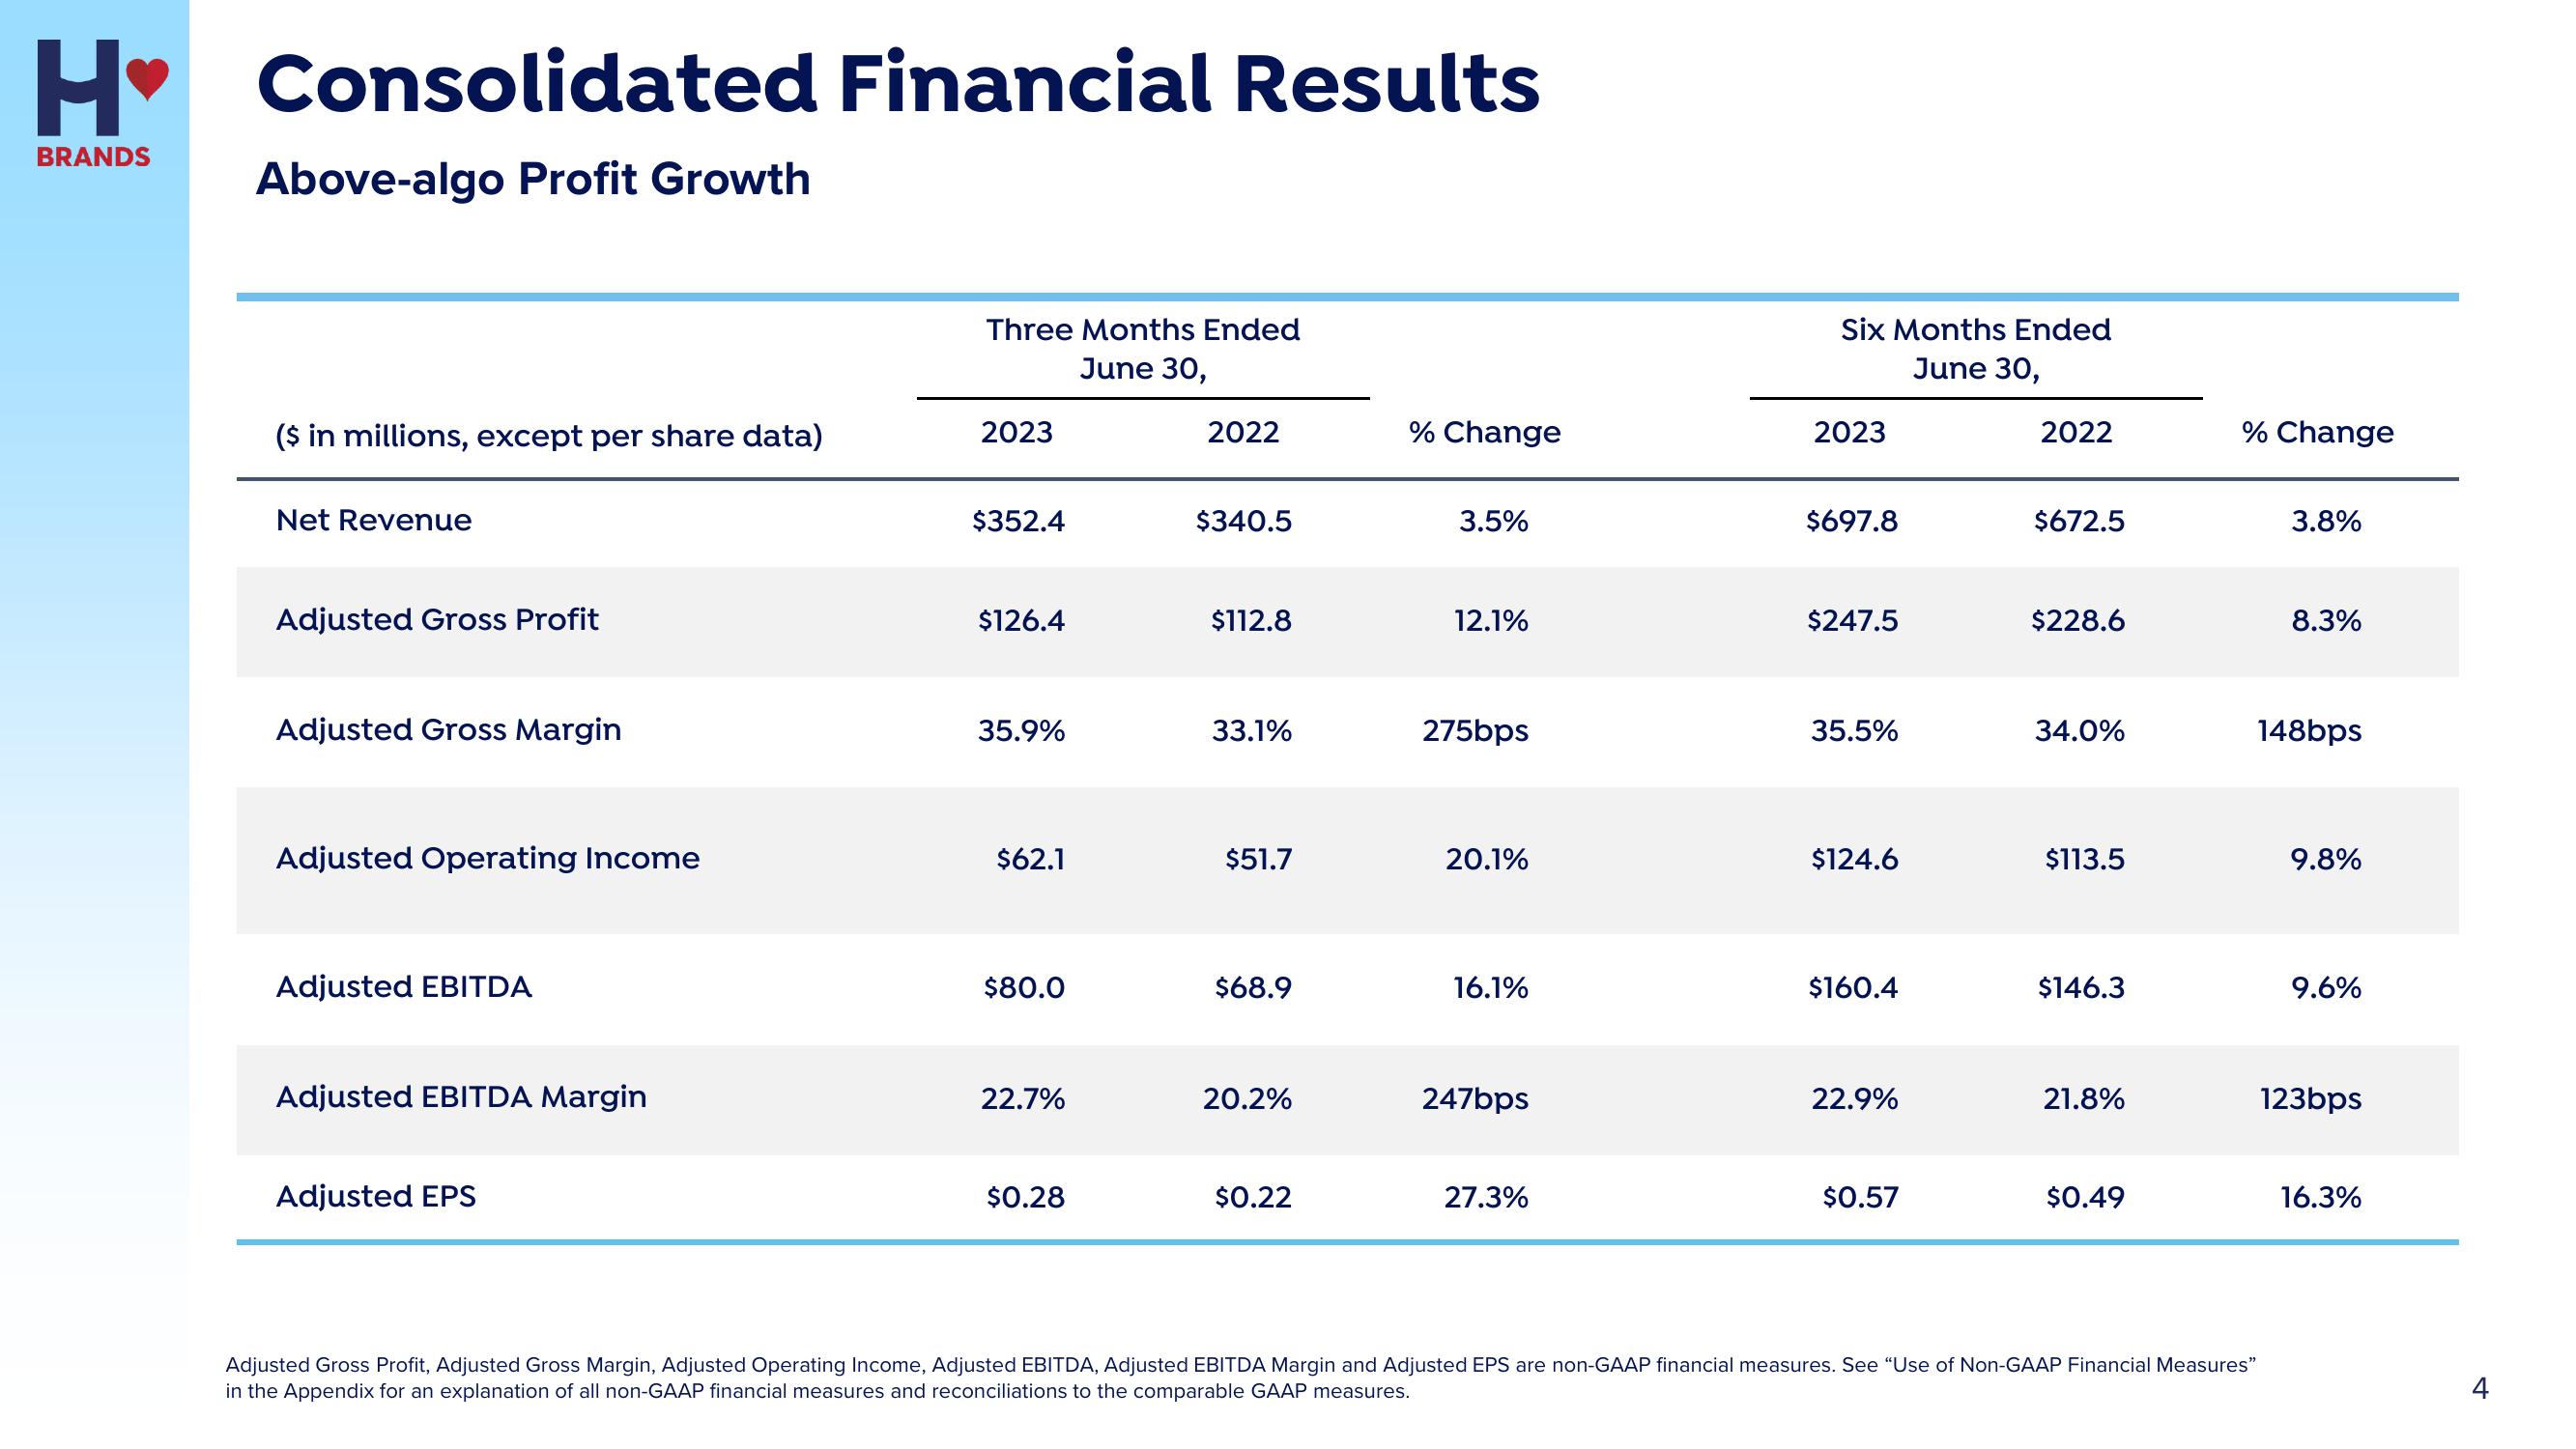
H♥ Consolidated Financial Results
H₁
BRANDS
Above-algo Profit Growth
($ in millions, except per share data)
Net Revenue
Adjusted Gross Profit
Adjusted Gross Margin
Adjusted Operating Income
Adjusted EBITDA
Adjusted EBITDA Margin
Adjusted EPS
Three Months Ended
June 30,
2023
$352.4
$126.4
35.9%
$62.1
$80.0
22.7%
$0.28
2022
$340.5
$112.8
33.1%
$51.7
$68.9
20.2%
$0.22
% Change
3.5%
12.1%
275bps
20.1%
16.1%
247bps
27.3%
Six Months Ended
June 30,
2023
$697.8
$247.5
35.5%
$124.6
$160.4
22.9%
$0.57
2022
$672.5
$228.6
34.0%
$113.5
$146.3
21.8%
$0.49
% Change
Adjusted Gross Profit, Adjusted Gross Margin, Adjusted Operating Income, Adjusted EBITDA, Adjusted EBITDA Margin and Adjusted EPS are non-GAAP financial measures. See "Use of Non-GAAP Financial Measures”
in the Appendix for an explanation of all non-GAAP financial measures and reconciliations to the comparable GAAP measures.
3.8%
8.3%
148bps
9.8%
9.6%
123bps
16.3%View entire presentation