flyExclusive SPAC
V. FINANCIAL OVERVIEW
REVENUE AND GROSS PROFIT SUMMARY
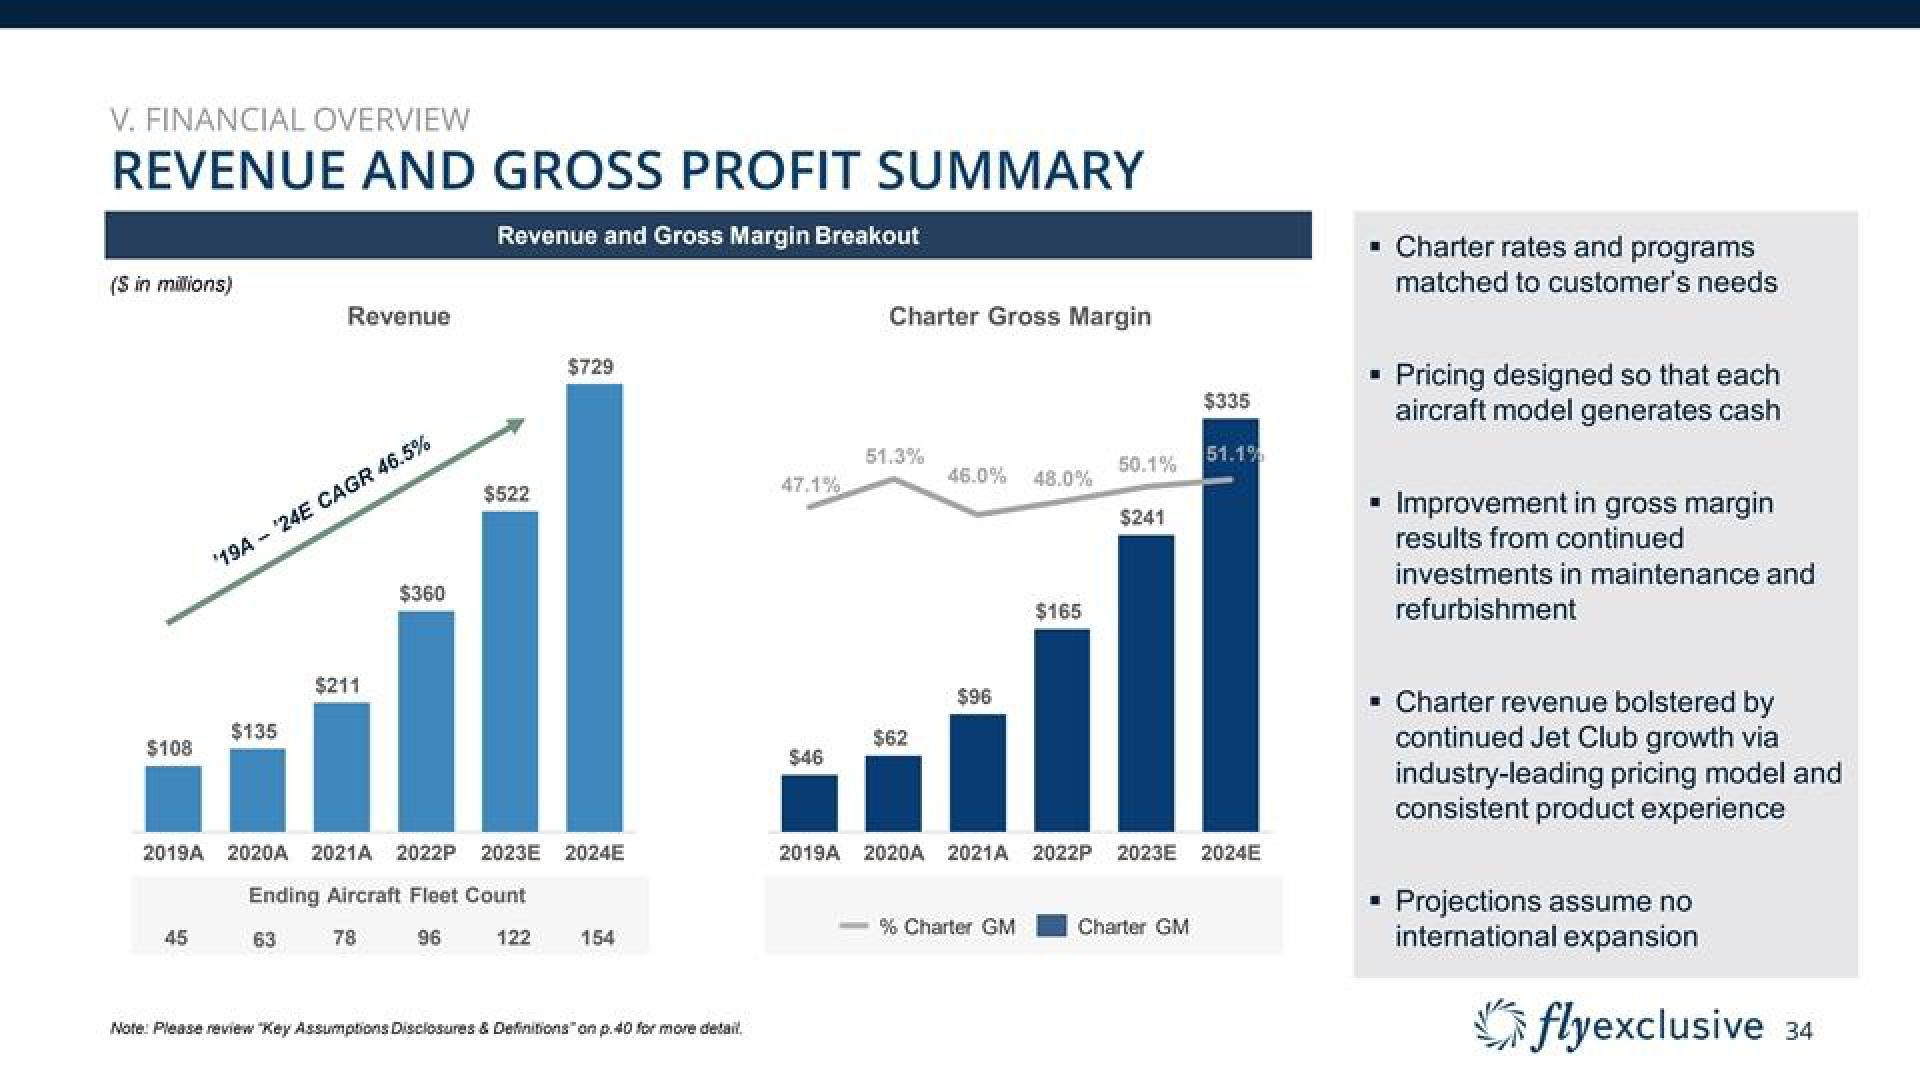
Revenue and Gross Margin Breakout
(S in millions)
$108
45
19A - '24E CAGR 46.5%
$135
Revenue
63
$211
$360
$522
2019A 2020A 2021A 2022P 2023E 2024E
Ending Aircraft Fleet Count
78
96
122
$729
154
Note: Please review "Key Assumptions Disclosures & Definitions on p.40 for more detail.
47.1%
$46
Charter Gross Margin
51.3%
$62
46.0% 48.0%
$96
$165
% Charter GM
50.1%
$241
$335
2019A 2020A 2021A 2022P 2023E 2024E
Charter GM
51.1%
▪ Charter rates and programs
matched to customer's needs
■
H
Pricing designed so that each
aircraft model generates cash
Improvement in gross margin
results from continued
investments in maintenance and
refurbishment
▪ Charter revenue bolstered by
continued Jet Club growth via
industry-leading pricing model and
consistent product experience
Projections assume no
international expansion
flyexclusive 34View entire presentation