Grubhub Investor Presentation Deck
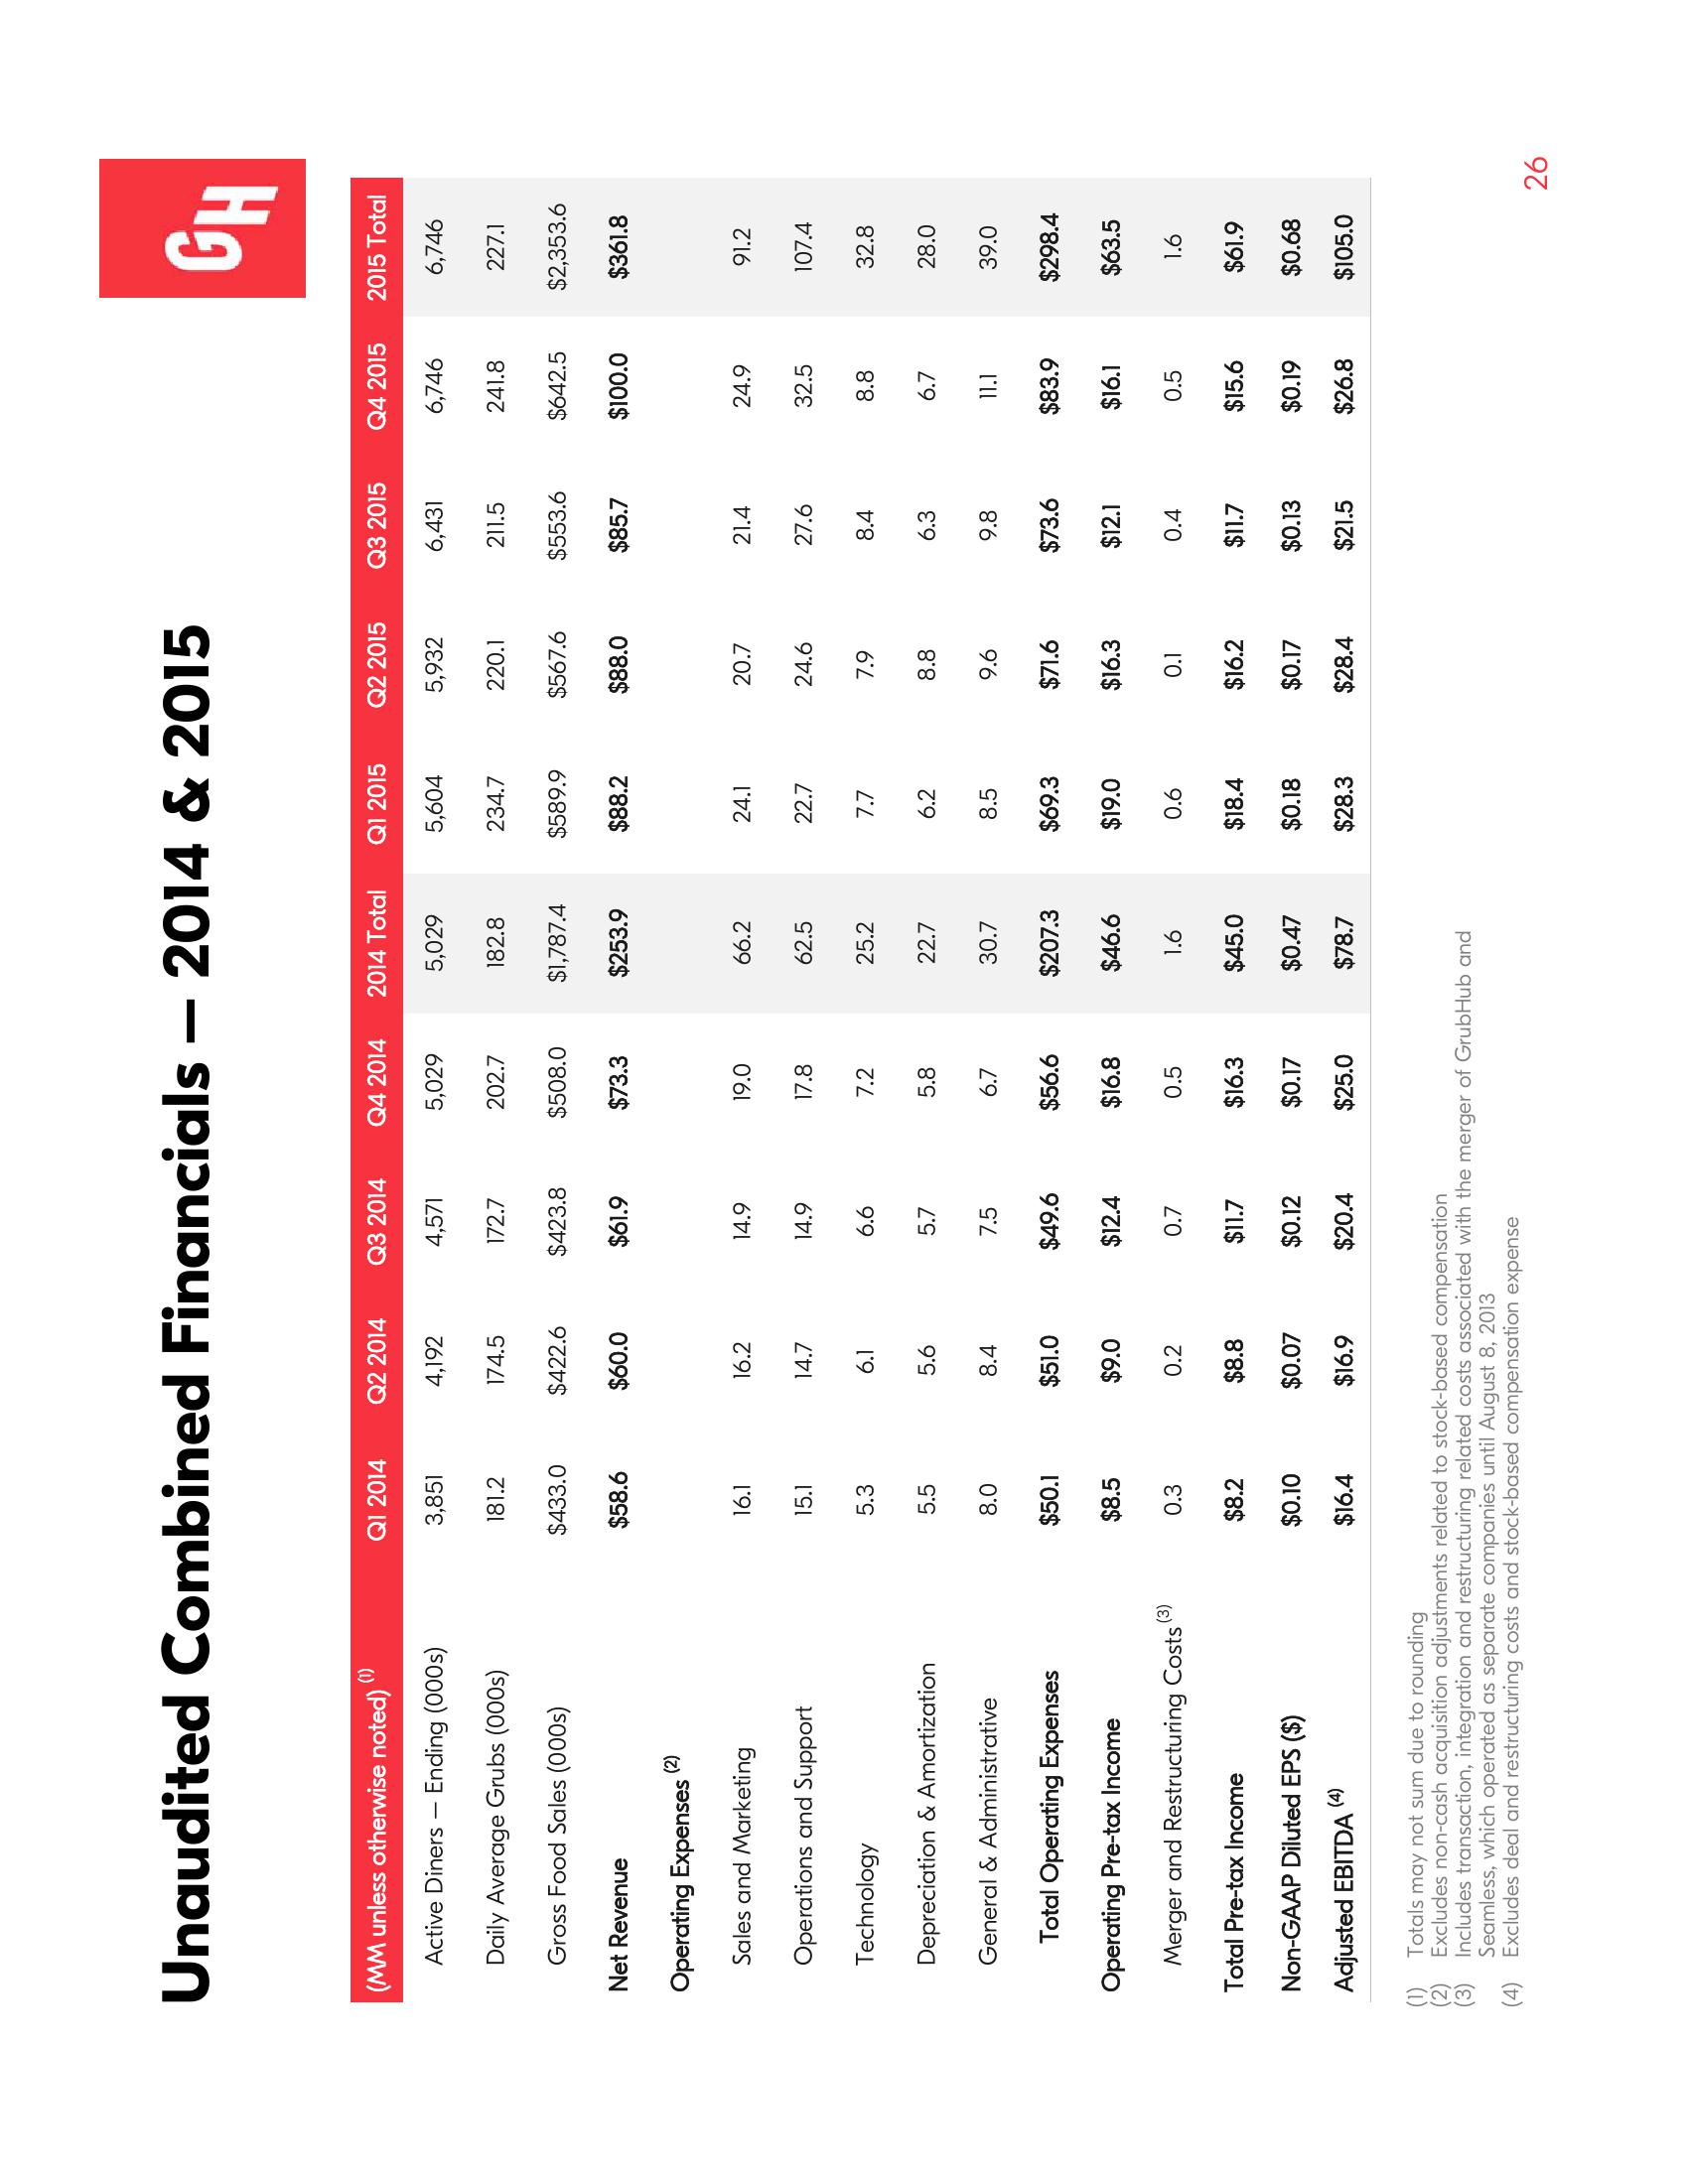
Unaudited Combined Financials - 2014 & 2015
(1)
(MM unless otherwise noted)
Active Diners Ending (000s)
Daily Average Grubs (000s)
Gross Food Sales (000s)
Net Revenue
Operating Expenses
(2)
Sales and Marketing
Operations and Support
Technology
Depreciation & Amortization
General & Administrative
(2)
(3)
(4)
Total Operating Expenses
Operating Pre-tax Income
(3)
Merger and Restructuring Costs
Total Pre-tax Income
Non-GAAP Diluted EPS ($)
Adjusted EBITDA (4)
Q1 2014
3,851
181.2
$433.0
$58.6
16.1
15.1
5.3
5.5
8.0
$50.1
$8.5
0.3
$8.2
$0.10
$16.4
Q2 2014
4,192
174.5
$422.6
$60.0
16.2
14.7
6.1
5.6
8.4
$51.0
$9.0
0.2
$8.8
$0.07
$16.9
Q3 2014
4,571
172.7
$423.8
$61.9
14.9
14.9
6.6
5.7
7.5
$49.6
$12.4
0.7
$11.7
$0.12
$20.4
Q4 2014 2014 Total Q1 2015
5,029
202.7
$508.0
$73.3
19.0
17.8
7.2
5.8
6.7
$56.6
$16.8
0.5
$16.3
$0.17
$25.0
5,029
182.8
$1,787.4
$253.9
66.2
62.5
25.2
22.7
30.7
$207.3
$46.6
1.6
$45.0
$0.47
$78.7
Totals may not sum due to rounding
Excludes non-cash acquisition adjustments related to stock-based compensation
Includes transaction, integration and restructuring related costs associated with the merger of GrubHub and
Seamless, which operated as separate companies until August 8, 2013
Excludes deal and restructuring costs and stock-based compensation expense
5,604
234.7
$589.9
$88.2
24.1
22.7
7.7
6.2
8.5
$69.3
$19.0
0.6
$18.4
$0.18
$28.3
Q2 2015
5,932
220.1
$567.6
$88.0
20.7
24.6
7.9
8.8
9.6
$71.6
$16.3
0.1
$16.2
$0.17
$28.4
Q3 2015
6,431
211.5
$553.6
$85.7
21.4
27.6
8.4
6.3
9.8
$73.6
$12.1
0.4
$11.7
$0.13
$21.5
Q4 2015
6,746
241.8
$642.5
$100.0
24.9
32.5
8.8
6.7
11.1
$83.9
$16.1
0.5
$15.6
$0.19
$26.8
GH
2015 Total
6,746
227.1
$2,353.6
$361.8
91.2
107.4
32.8
28.0
39.0
$298.4
$63.5
1.6
$61.9
$0.68
$105.0
26View entire presentation