Spotify Results Presentation Deck
Operating Expenses
Growth largely driven by headcount expansion and unfavorable FX impact
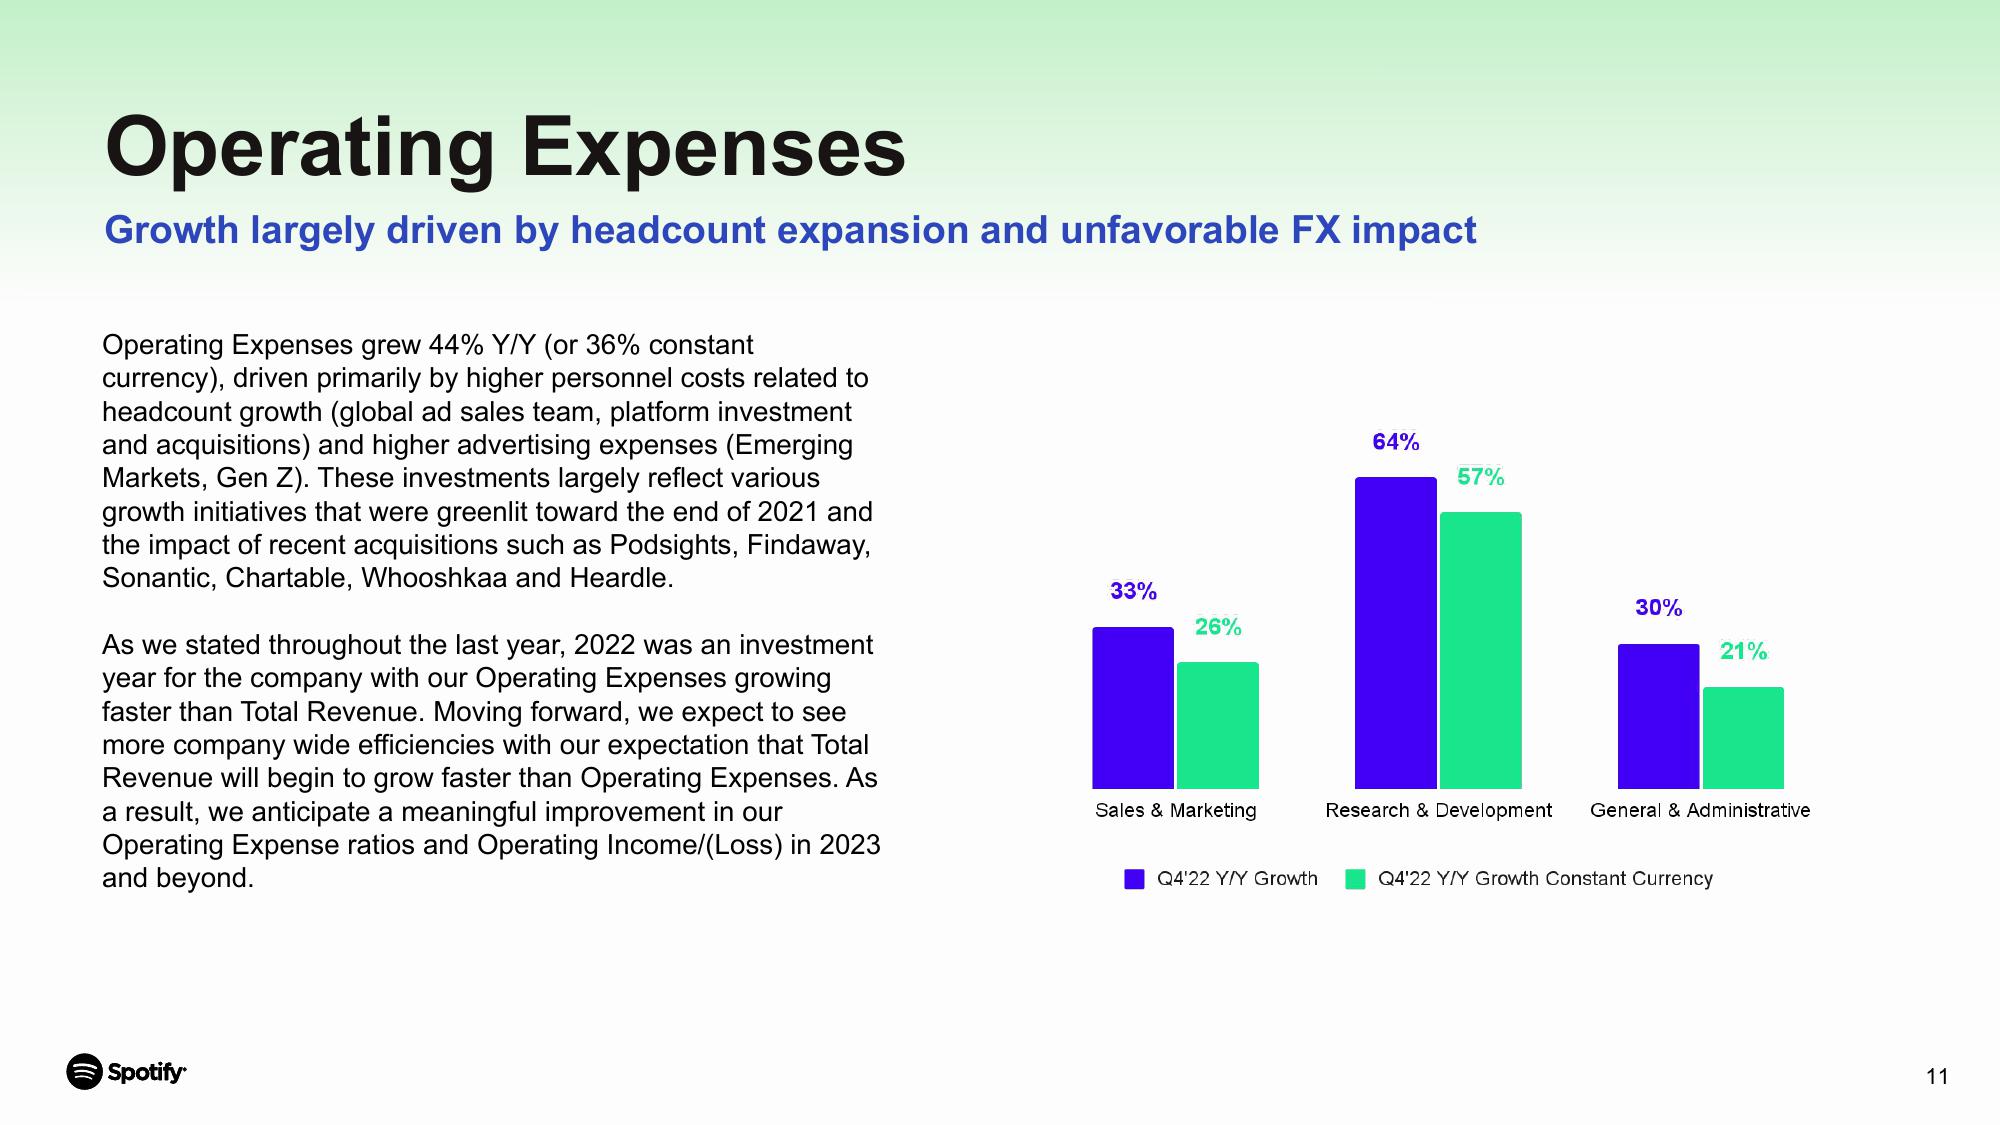
Operating Expenses grew 44% Y/Y (or 36% constant
currency), driven primarily by higher personnel costs related to
headcount growth (global ad sales team, platform investment
and acquisitions) and higher advertising expenses (Emerging
Markets, Gen Z). These investments largely reflect various
growth initiatives that were greenlit toward the end of 2021 and
the impact of recent acquisitions such as Podsights, Findaway,
Sonantic, Chartable, Whooshkaa and Heardle.
As we stated throughout the last year, 2022 was an investment
year for the company with our Operating Expenses growing
faster than Total Revenue. Moving forward, we expect to see
more company wide efficiencies with our expectation that Total
Revenue will begin to grow faster than Operating Expenses. As
a result, we anticipate a meaningful improvement in our
Operating Expense ratios and Operating Income/(Loss) in 2023
and beyond.
Spotify
33%
26%
Sales & Marketing
Q4'22 Y/Y Growth
64%
57%
30%
21%
Research & Development General & Administrative
Q4'22 Y/Y Growth Constant Currency
11View entire presentation