Asos Results Presentation Deck
2023 asos
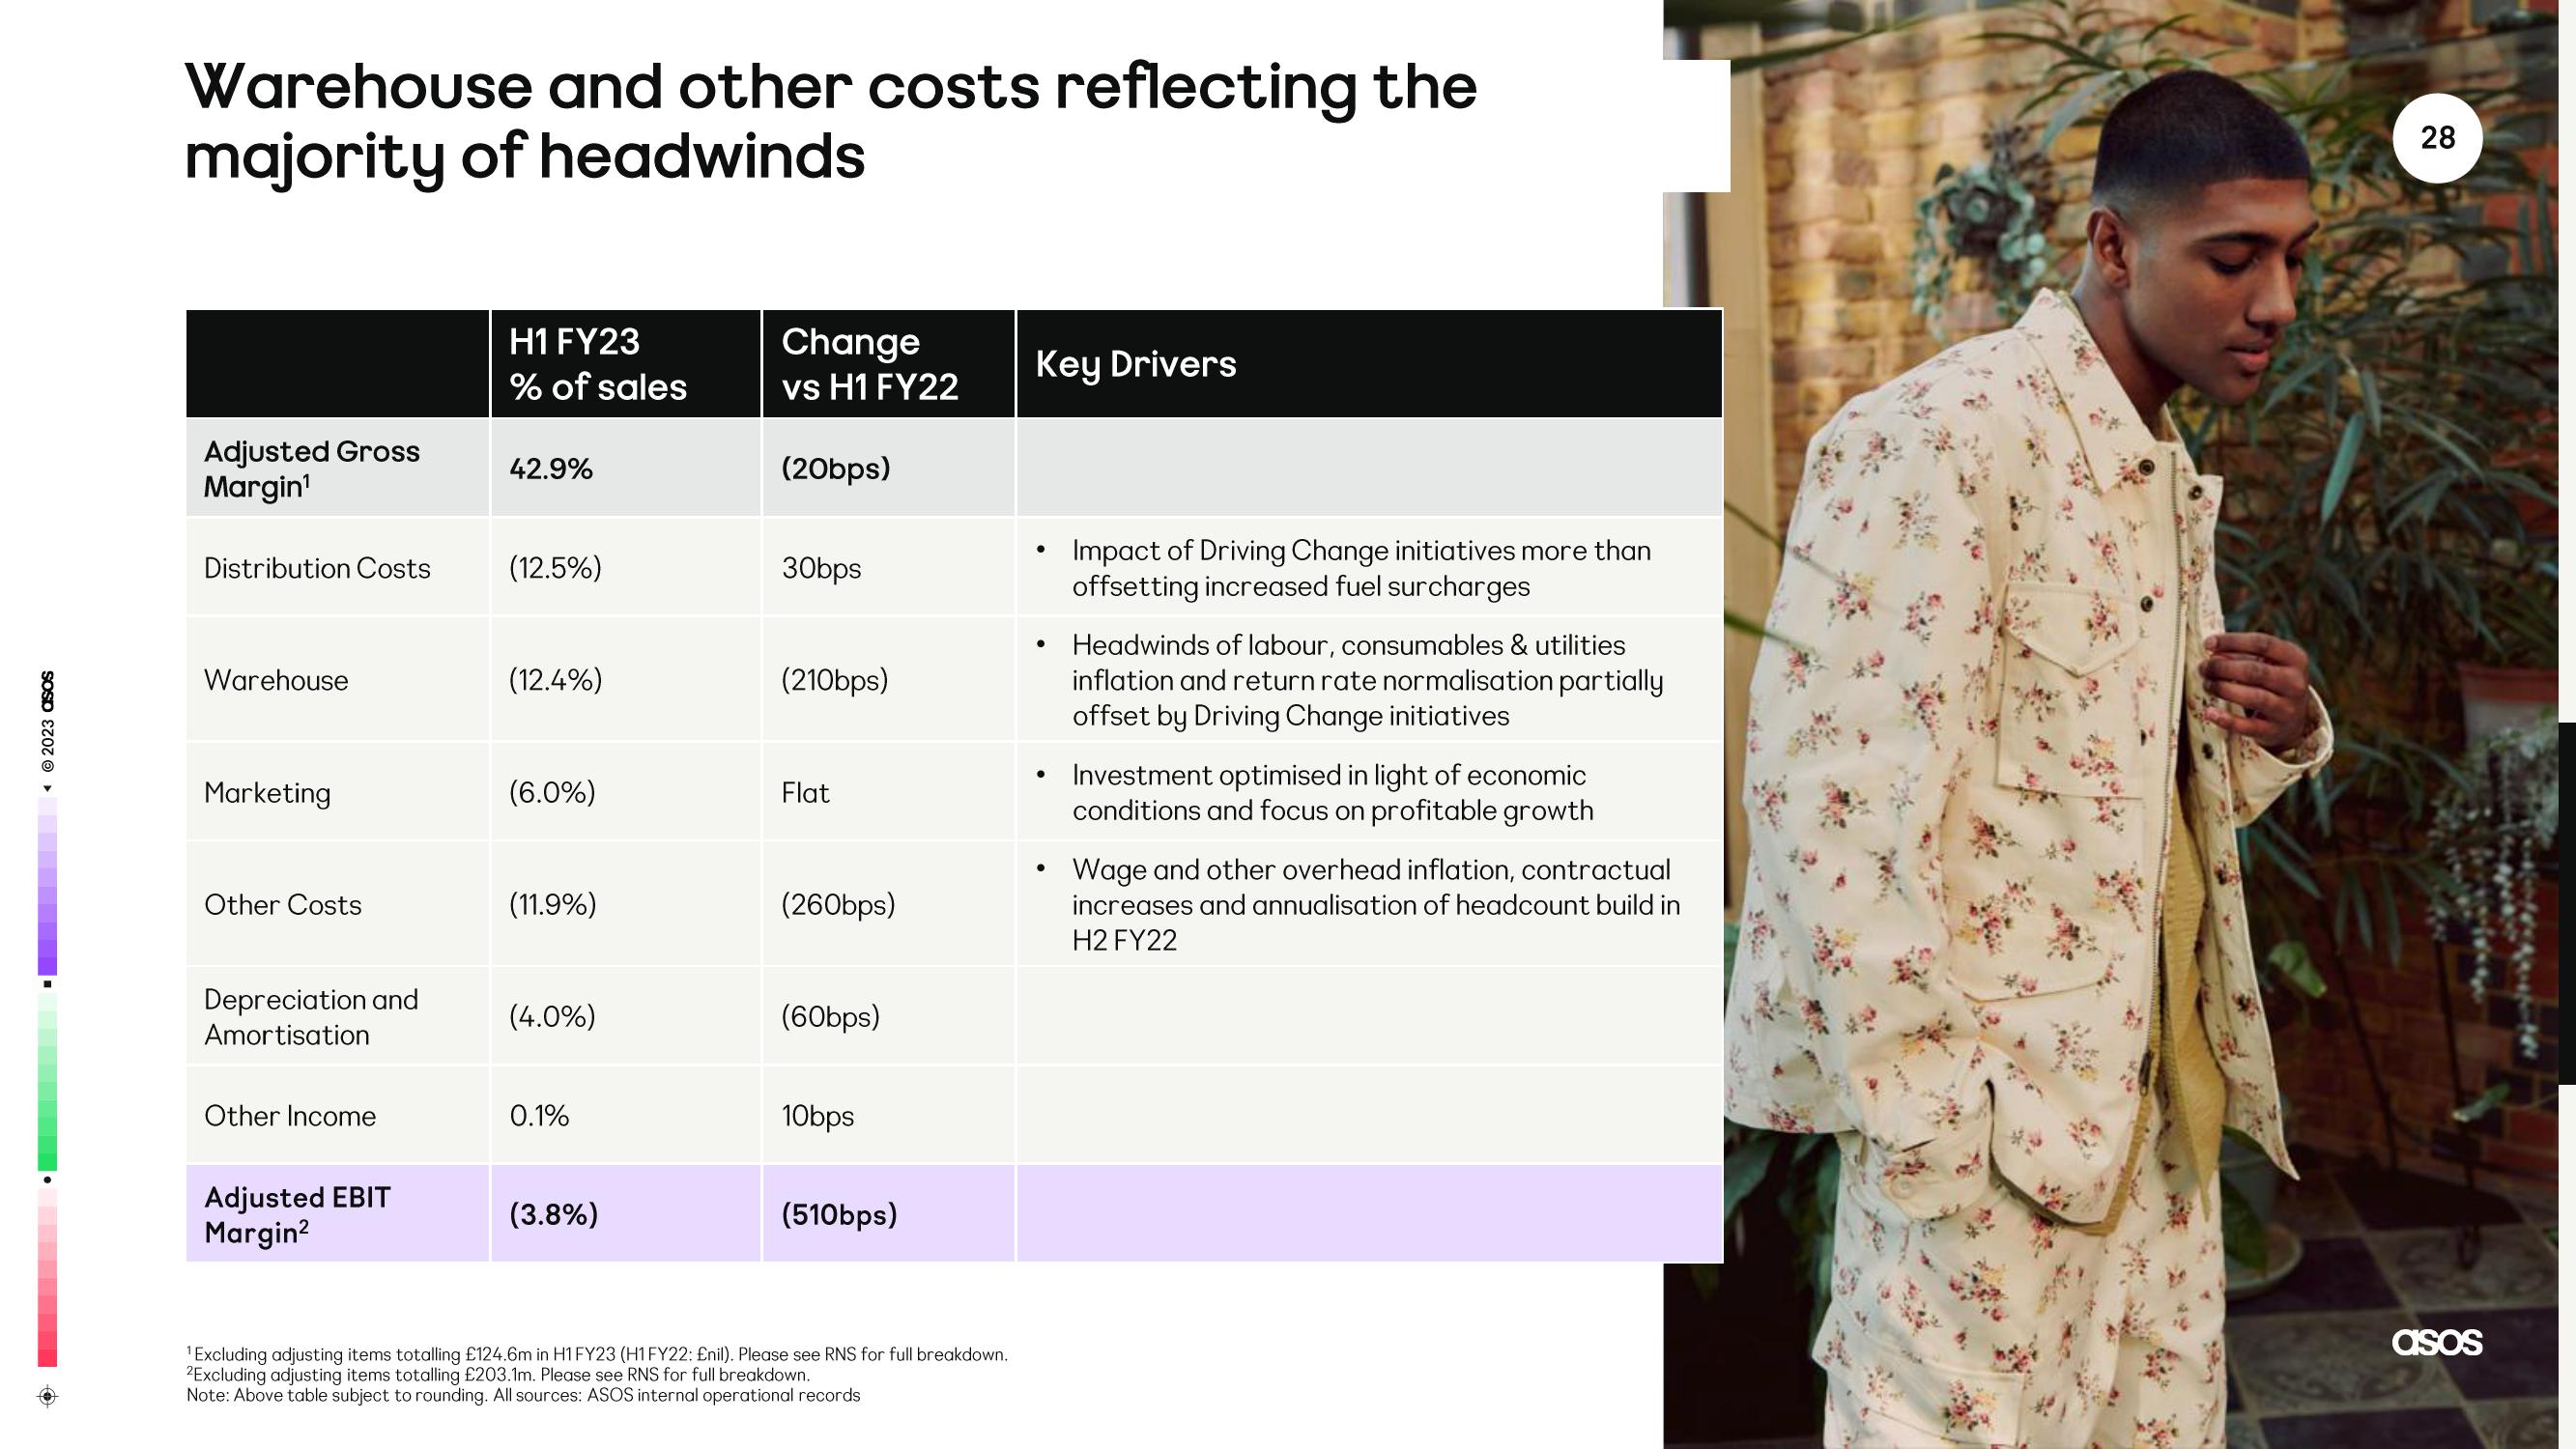
Warehouse and other costs reflecting the
majority of headwinds
Adjusted Gross
Margin¹
Distribution Costs
Warehouse
Marketing
Other Costs
Depreciation and
Amortisation
Other Income
Adjusted EBIT
Margin²
H1 FY23
% of sales
42.9%
(12.5%)
(12.4%)
(6.0%)
(11.9%)
(4.0%)
0.1%
(3.8%)
Change
vs H1 FY22
(20bps)
30bps
(210bps)
Flat
(260bps)
(60bps)
10bps
(510bps)
¹Excluding adjusting items totalling £124.6m in H1 FY23 (H1 FY22: £nil). Please see RNS for full breakdown.
2Excluding adjusting items totalling £203.1m. Please see RNS for full breakdown.
Note: Above table subject to rounding. All sources: ASOS internal operational records
Key Drivers
●
●
●
Impact of Driving Change initiatives more than
offsetting increased fuel surcharges
Headwinds of labour, consumables & utilities
inflation and return rate normalisation partially
offset by Driving Change initiatives
Investment optimised in light of economic
conditions and focus on profitable growth
Wage and other overhead inflation, contractual
increases and annualisation of headcount build in
H2 FY22
28
asosView entire presentation