jetBlue Mergers and Acquisitions Presentation Deck
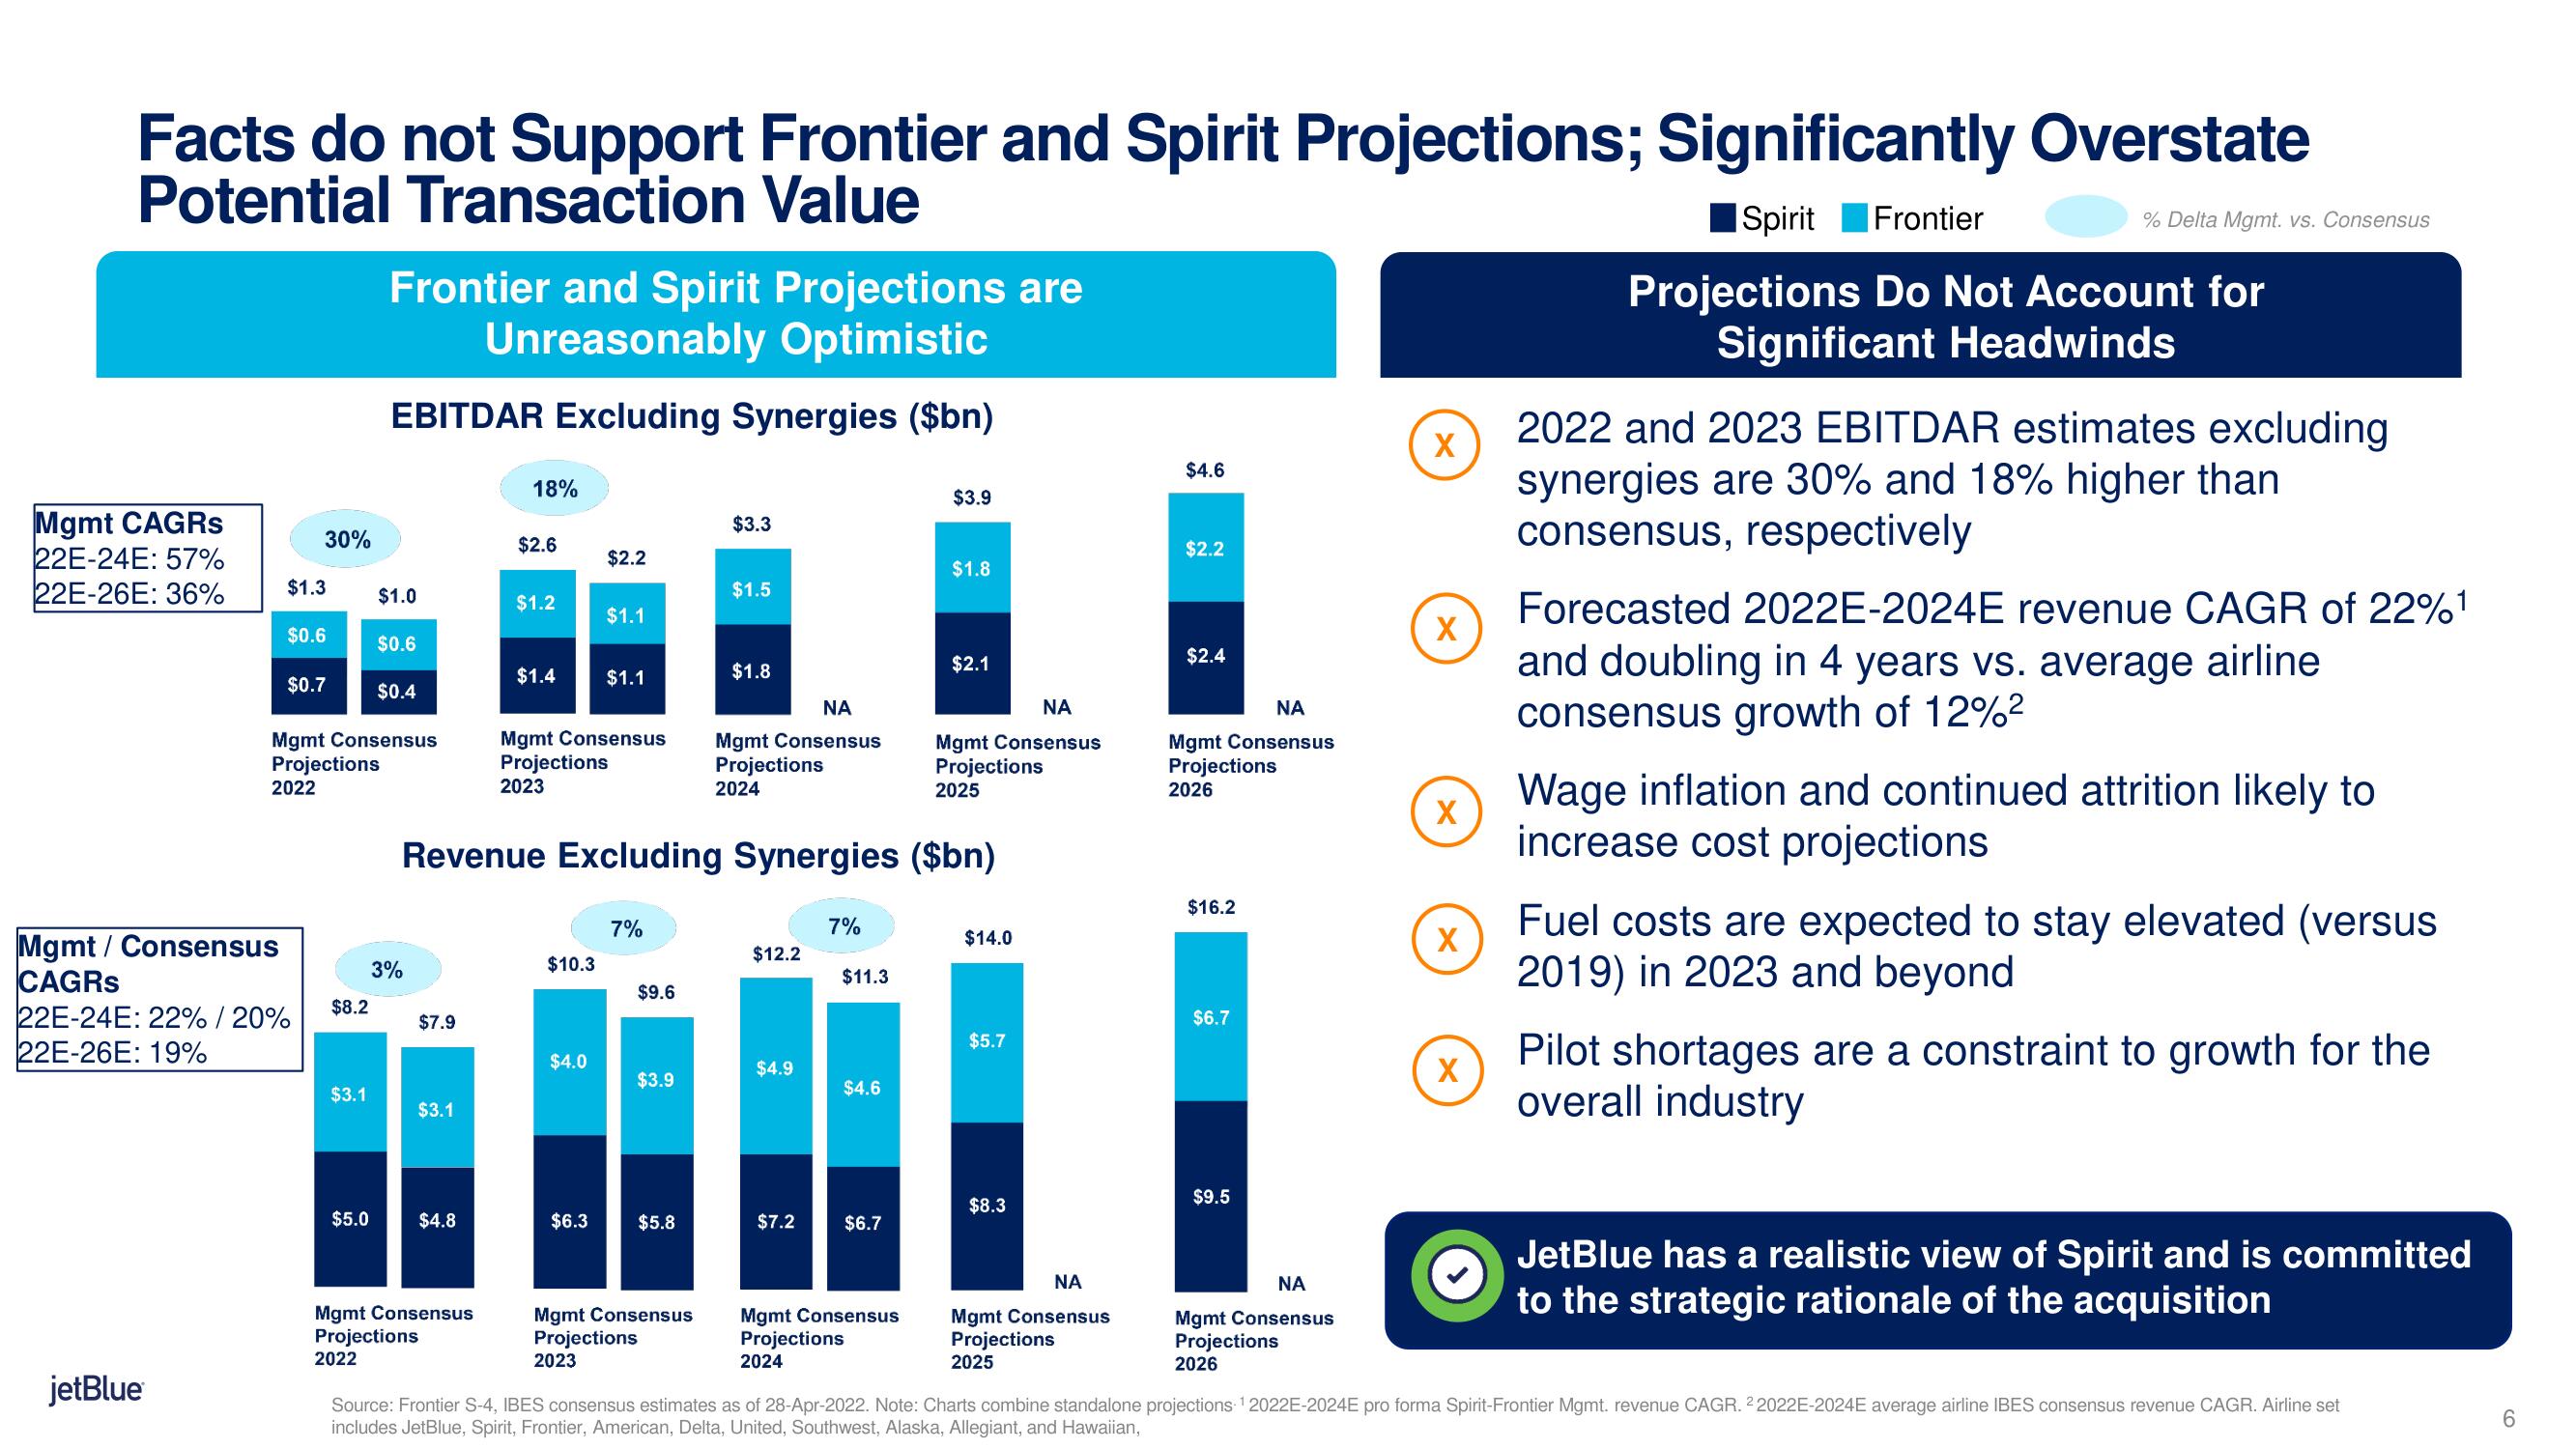
Facts do not Support Frontier and Spirit Projections; Significantly Overstate
Potential Transaction Value
Mgmt CAGRs
22E-24E: 57%
22E-26E: 36%
Mgmt / Consensus
CAGRS
jetBlue
30%
$1.3
$0.6
$0.7
22E-24E: 22% / 20%
22E-26E: 19%
Mgmt Consensus
Projections
2022
$8.2
$3.1
Frontier and Spirit Projections are
Unreasonably Optimistic
EBITDAR Excluding Synergies ($bn)
$5.0
$1.0
$0.6
$0.4
3%
$7.9
$3.1
$4.8
18%
Mgmt Consensus
Projections
2022
$2.6
$1.2
$1.4
$10.3
$2.2
Mgmt Consensus
Projections
2023
$4.0
$1.1
$6.3
$1.1
Revenue Excluding Synergies ($bn)
7%
$9.6
$3.9
$5.8
$3.3
Mgmt Consensus
Projections
2023
$1.5
$1.8
ΝΑ
Mgmt Consensus
Projections
2024
$12.2
$4.9
$7.2
7%
$11.3
$4.6
$6.7
$3.9
Mgmt Consensus
Projections
2024
$1.8
$2.1
ΝΑ
Mgmt Consensus
Projections
2025
$14.0
$5.7
$8.3
ΝΑ
Mgmt Consensus
Projections
2025
$4.6
$2.2
$2.4
ΝΑ
Mgmt Consensus
Projections
2026
$16.2
$6.7
$9.5
ΝΑ
Mgmt Consensus
Projections
2026
X
X
X
X
X
Spirit Frontier
Projections Do Not Account for
Significant Headwinds
% Delta Mgmt. vs. Consensus
2022 and 2023 EBITDAR estimates excluding
synergies are 30% and 18% higher than
consensus, respectively
Forecasted 2022E-2024E revenue CAGR of 22%¹
and doubling in 4 years vs. average airline
consensus growth of 12%²
Wage inflation and continued attrition likely to
increase cost projections
Fuel costs are expected to stay elevated (versus
2019) in 2023 and beyond
Pilot shortages are a constraint to growth for the
overall industry
JetBlue has a realistic view of Spirit and is committed
to the strategic rationale of the acquisition
Source: Frontier S-4, IBES consensus estimates as of 28-Apr-2022. Note: Charts combine standalone projections ¹2022E-2024E pro forma Spirit-Frontier Mgmt. revenue CAGR. 22022E-2024E average airline IBES consensus revenue CAGR. Airline set
includes JetBlue, Spirit, Frontier, American, Delta, United, Southwest, Alaska, Allegiant, and Hawaiian,
6View entire presentation