Crocs Investor Presentation Deck
Cr
CS
cr
CS
CI
OC!
BUSINESS & FINANCIAL HIGHLIGHTS
2022 REVENUE GROWTH SUMMARY
1.
2.
3.
4.
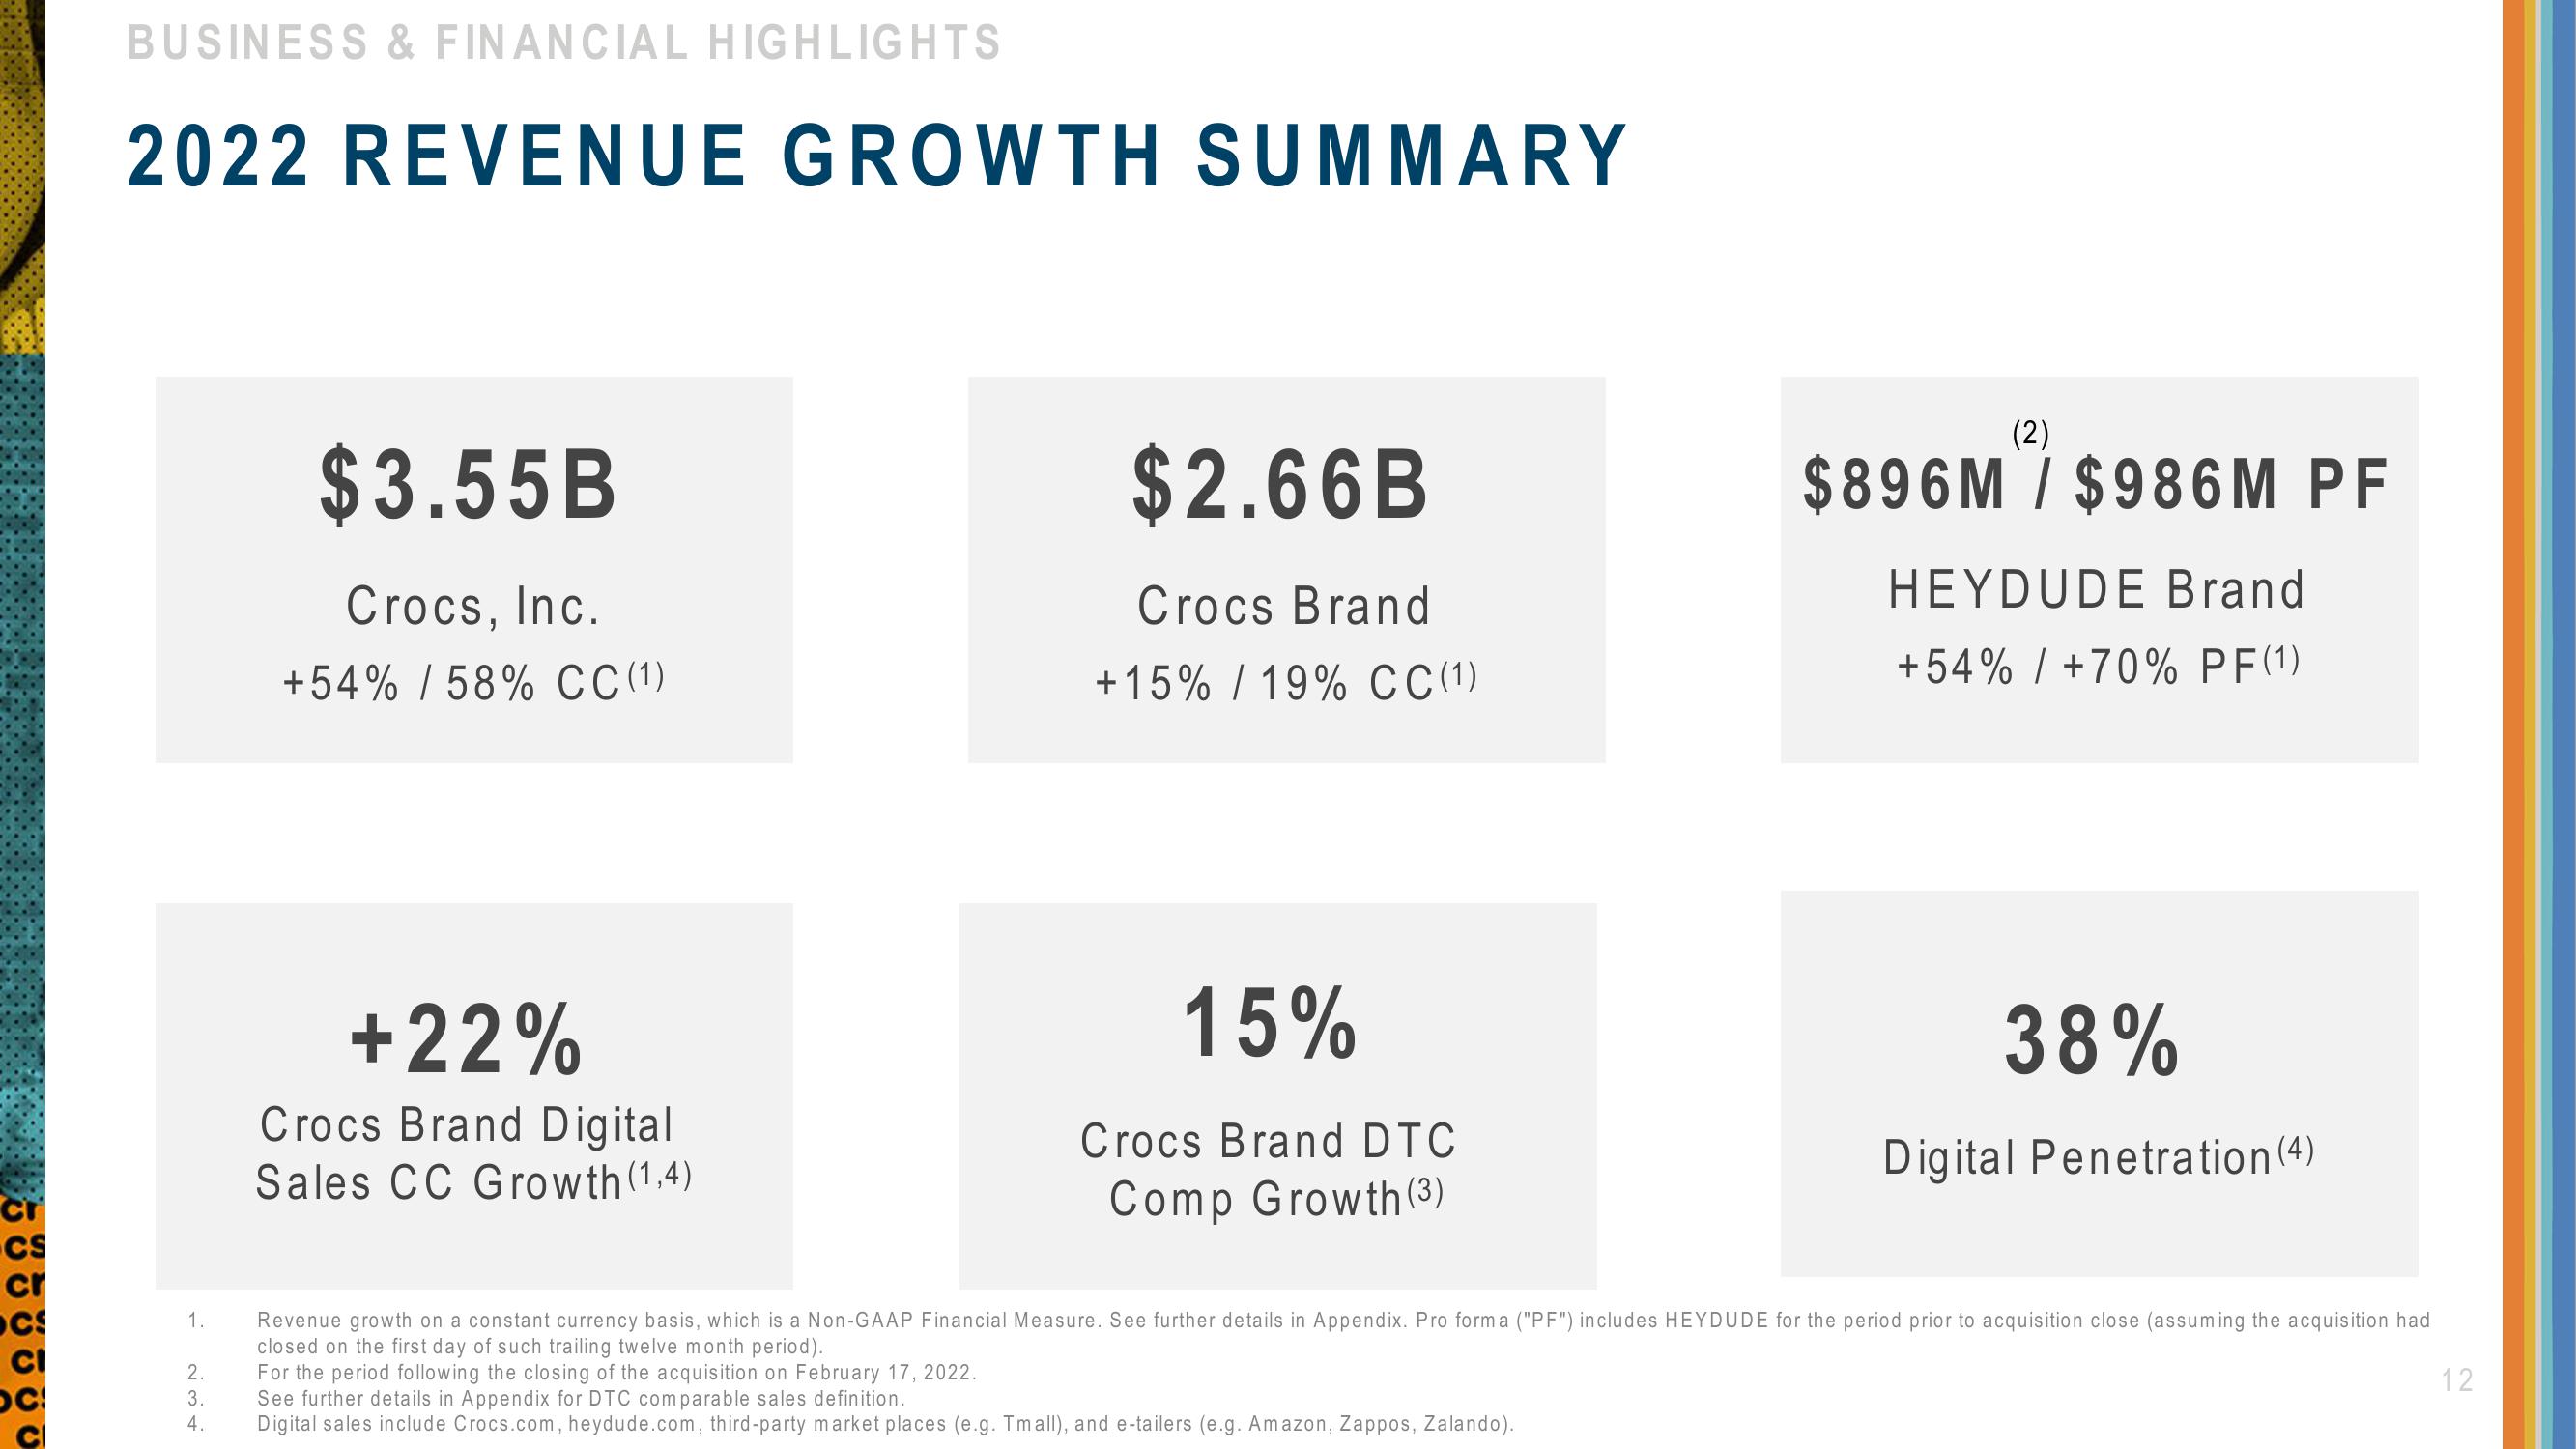
$3.55B
Crocs, Inc.
+54% / 58% CC (1)
+22%
Crocs Brand Digital
Sales CC Growth (1.4)
$2.66B
Crocs Brand
+15% / 19% CC (1)
15%
Crocs Brand DTC
Comp Growth (3)
(2)
$896M / $986M PF
HEYDUDE Brand
+54% / +70% PF(1)
38%
Digital Penetration (4)
Revenue growth on a constant currency basis, which is a Non-GAAP Financial Measure. See further details in Appendix. Pro forma ("PF") includes HEYDUDE for the period prior to acquisition close (assuming the acquisition had
closed on the first day of such trailing twelve month period).
For the period following the closing of the acquisition on February 17, 2022.
See further details in Appendix for DTC comparable sales definition.
Digital sales include Crocs.com, heydude.com, third-party market places (e.g. Tmall), and e-tailers (e.g. Amazon, Zappos, Zalando).
12View entire presentation