SoftBank Results Presentation Deck
=SoftBank
Historical NAV
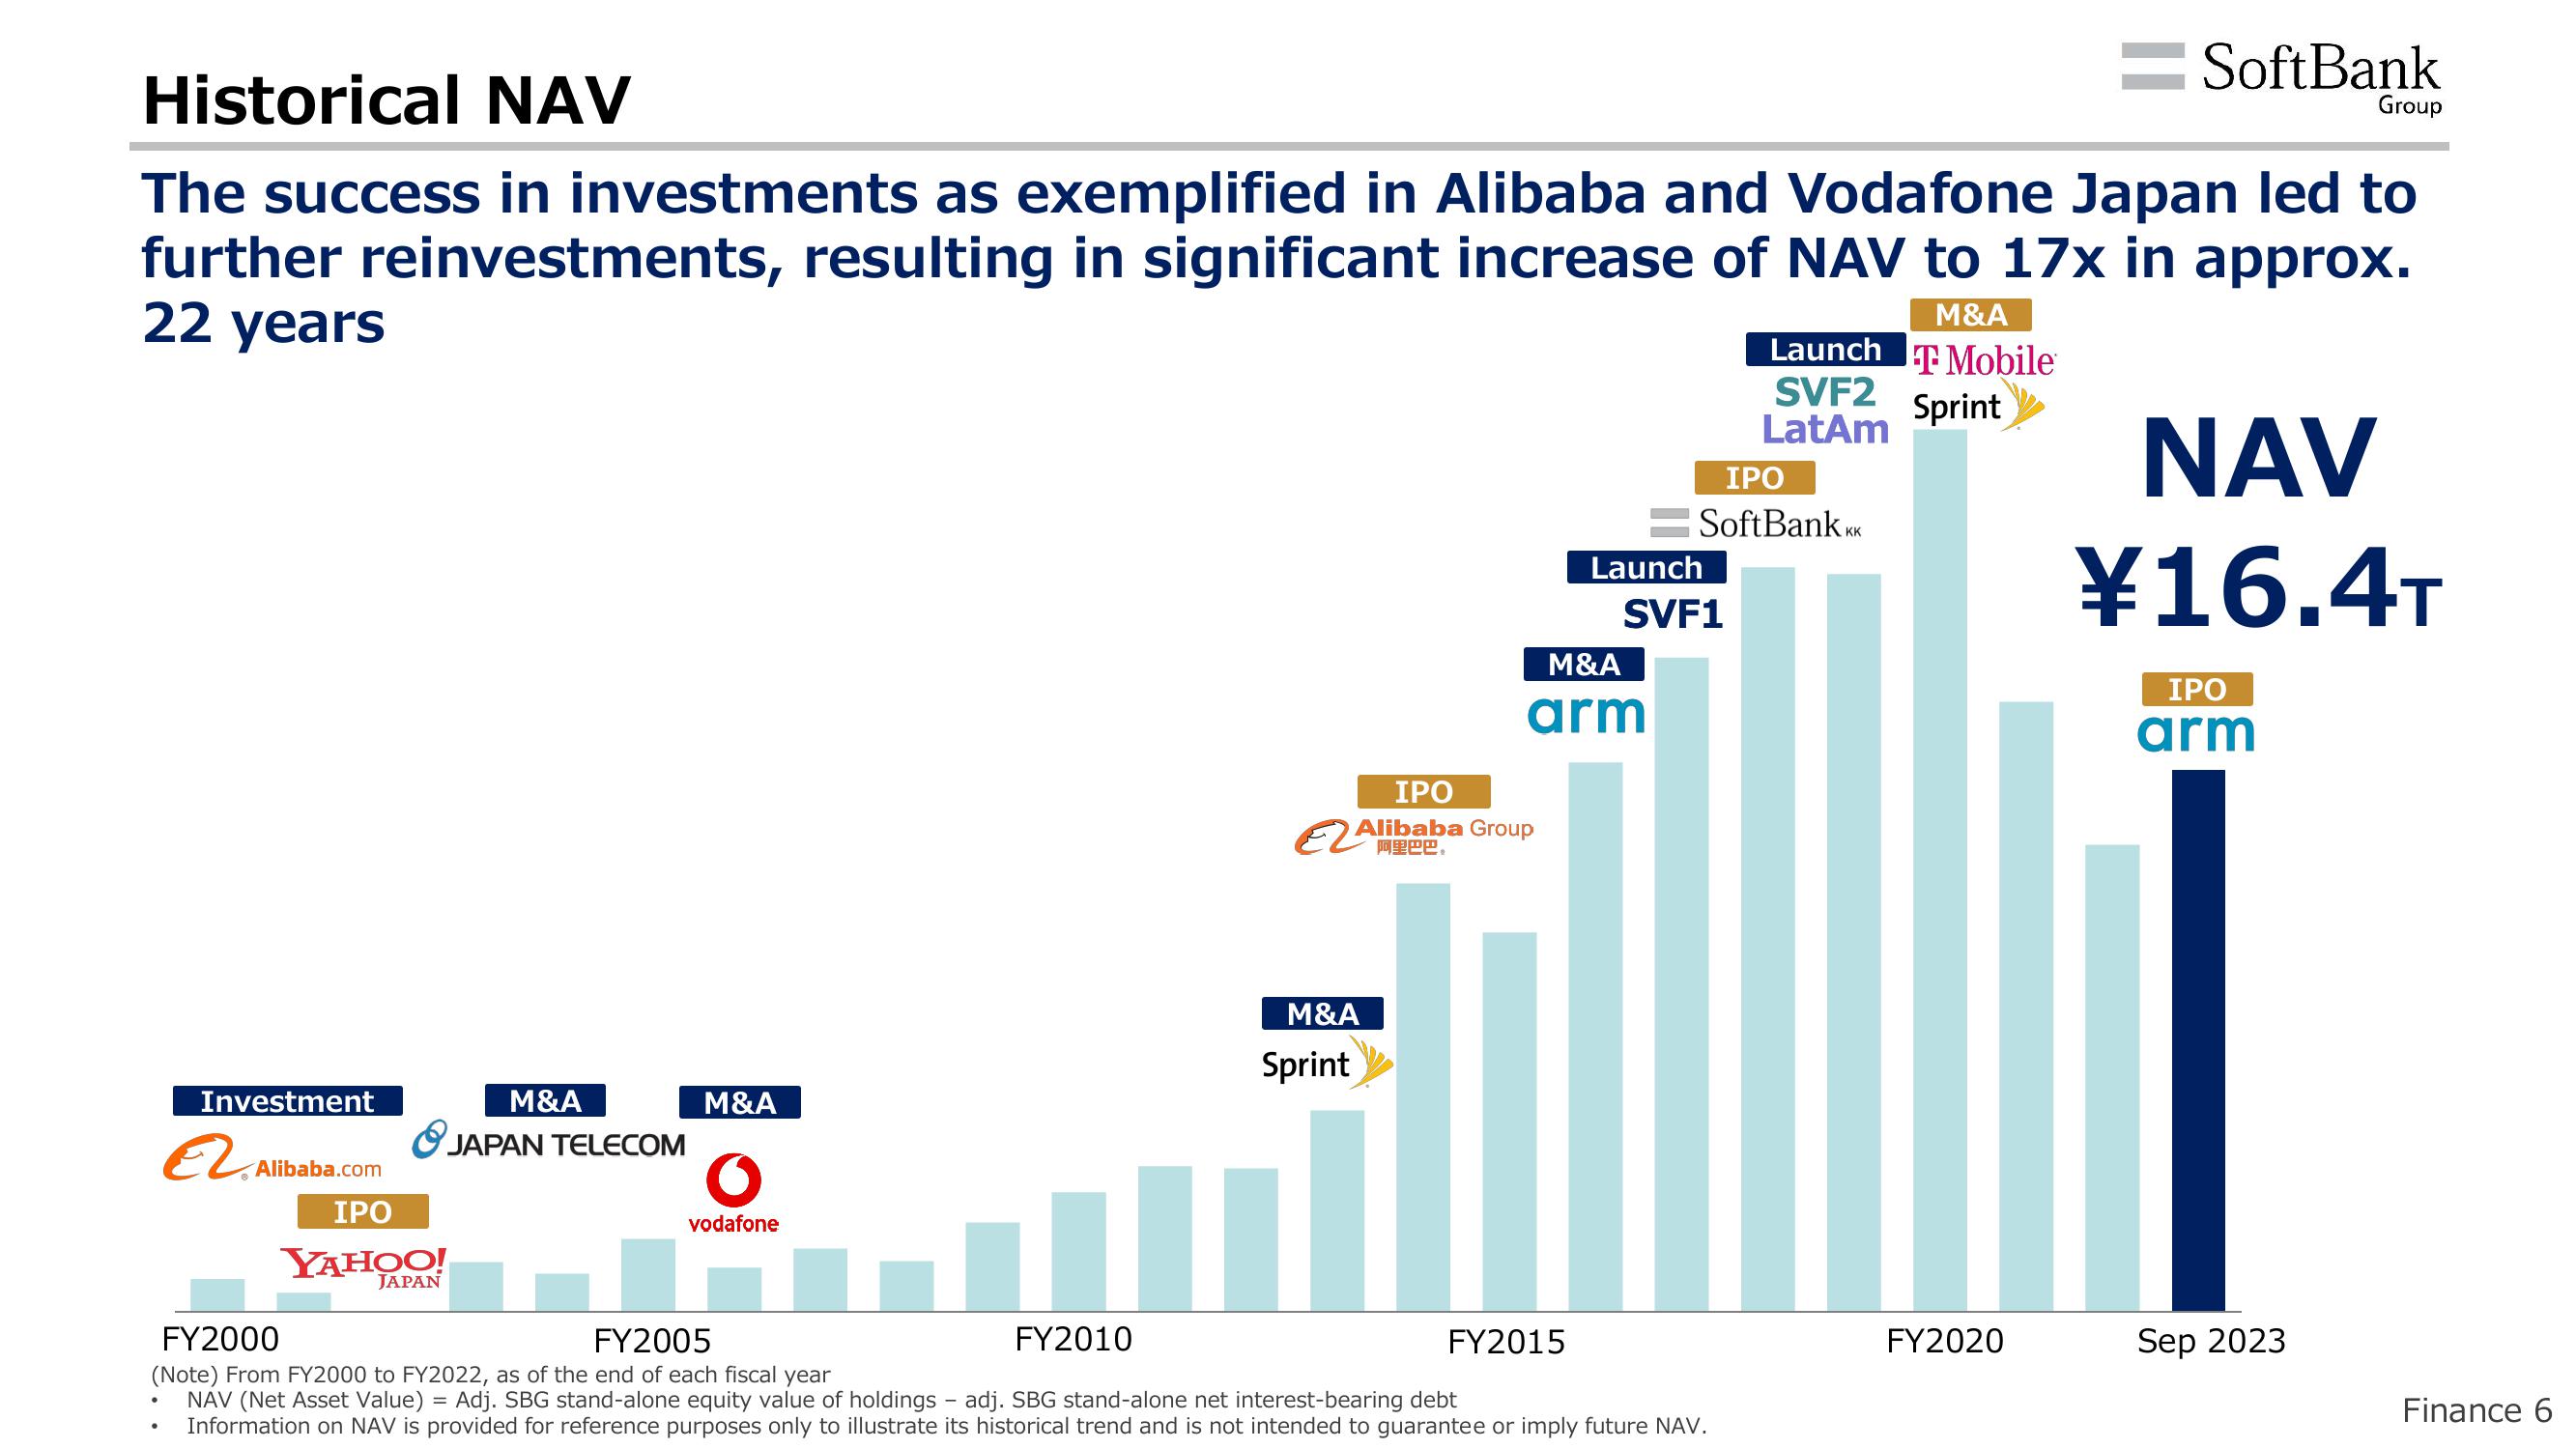
The success in investments as exemplified in Alibaba and Vodafone Japan led to
further reinvestments, resulting in significant increase of NAV to 17x in approx.
22 years
M&A
T Mobile
Sprint
Investment
€ Aliba
Alibaba.com
M&A
JAPAN TELECOM
IPO
YAHOO!
JAPAN
M&A
O
vodafone
FY2010
€22.
IPO
Alibaba Group
M&A
Sprint
M&A
arm
Launch
FY2015
IPO
SoftBank K
KK
SVF1
FY2000
FY2005
(Note) From FY2000 to FY2022, as of the end of each fiscal year
NAV (Net Asset Value) = Adj. SBG stand-alone equity value of holdings - adj. SBG stand-alone net interest-bearing debt
Information on NAV is provided for reference purposes only to illustrate its historical trend and is not intended to guarantee or imply future NAV.
Launch
SVF2
LatAm
FY2020
NAV
¥16.4T
IPO
arm
Group
Sep 2023
Finance 6View entire presentation