Lyft Results Presentation Deck
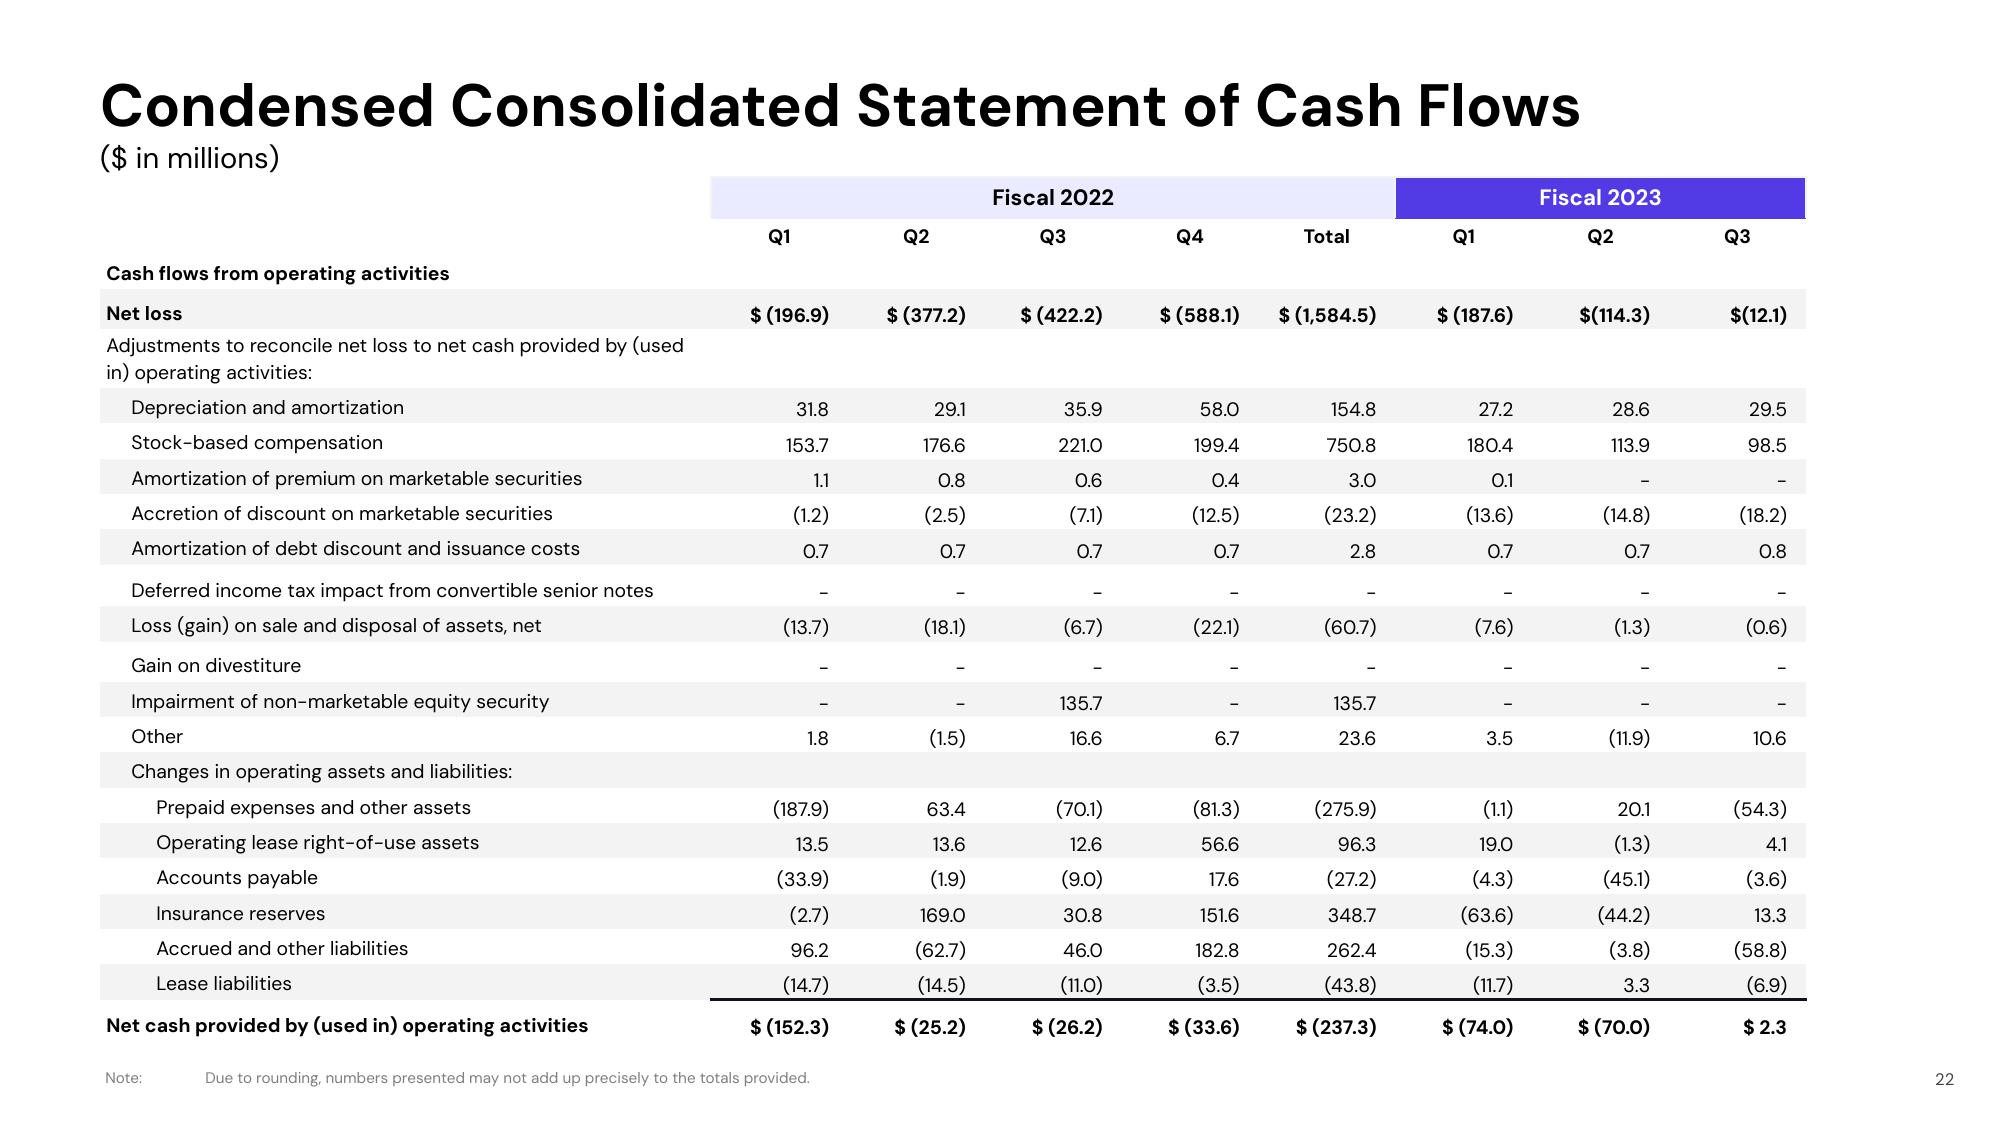
Condensed Consolidated Statement of Cash Flows
($ in millions)
Cash flows from operating activities
Net loss
Adjustments to reconcile net loss to net cash provided by (used
in) operating activities:
Depreciation and amortization
Stock-based compensation
Amortization of premium on marketable securities
Accretion of discount on marketable securities
Amortization of debt discount and issuance costs
Deferred income tax impact from convertible senior notes
Loss (gain) on sale and disposal of assets, net
Gain on divestiture
Impairment of non-marketable equity security
Other
Changes in operating assets and liabilities:
Prepaid expenses and other assets
Operating lease right-of-use assets
Accounts payable
Insurance reserves
Accrued and other liabilities
Lease liabilities
Net cash provided by (used in) operating activities
Note:
Q1
$ (196.9)
31.8
153.7
1.1
(1.2)
0.7
(13.7)
1.8
(187.9)
13.5
(33.9)
(2.7)
96.2
(14.7)
$ (152.3)
Due to rounding, numbers presented may not add up precisely to the totals provided.
Q2
$ (377.2)
29.1
176.6
0.8
(2.5)
0.7
(18.1)
(1.5)
63.4
13.6
(1.9)
169.0
(62.7)
(14.5)
$ (25.2)
Fiscal 2022
Q3
$ (422.2)
35.9
221.0
0.6
(7.1)
0.7
(6.7)
135.7
16.6
(70.1)
12.6
(9.0)
30.8
46.0
(11.0)
$ (26.2)
Q4
$ (588.1) $ (1,584.5)
58.0
199.4
0.4
(12.5)
0.7
(22.1)
6.7
Total
(81.3)
56.6
17.6
151.6
182.8
(3.5)
$ (33.6)
154.8
750.8
3.0
(23.2)
2.8
(60.7)
135.7
23.6
(275.9)
96.3
(27.2)
348.7
262.4
(43.8)
$ (237.3)
Q1
$ (187.6)
27.2
180.4
0.1
(13.6)
0.7
(7.6)
3.5
(1.1)
19.0
(4.3)
(63.6)
(15.3)
(11.7)
$ (74.0)
Fiscal 2023
Q2
$(114.3)
28.6
113.9
(14.8)
0.7
(1.3)
(11.9)
20.1
(1.3)
(45.1)
(44.2)
(3.8)
3.3
$ (70.0)
Q3
$(12.1)
29.5
98.5
(18.2)
0.8
(0.6)
10.6
(54.3)
4.1
(3.6)
13.3
(58.8)
(6.9)
$2.3
22View entire presentation